SPY will go ex-dividend Friday, June 19th, 2026, with a second-quarter dividend I am estimating, based on historical patterns of $1.62 per share. SPY’s next distribution payout will be on July 30th, 2026—yes the SPDR folks take their time delivering the dividend. iShares’ IVV, one of the other two big S&P 500 ETFs, went ex-dividend on Dec 17th, with a dividend $2.414 per share. Vanguard’s VOO went ex-dividend on the 26nd with a dividend of $1.771 per share. Vanguard does not release their ex-div dates and distribution dates until just a few days before they happen, so the future dates below are estimates. VOO and IVV are much faster at distributing the dividends—both pay within a week of their ex-dividend dates. IVV and VOO reinvest dividends into their constituent stocks until the payout date arrives. SPY’s Unit Investment Trust legal structure restricts SPY to hold dividends in cash until they are paid out.
SPY recently lost its spot as the largest ETF in the world, to Vanguard’s VOO. VOO has $831 Billion compared to SPY’s $781 billion in assets under management. The next largest ETF that tracks the S&P 500 is iShare’s IVV—currently with $732 billion. The table below summarizes dividend information for SPY, IVV, and VOO. Vanguard only publishes ex-dividend dates a few days prior to the ex-dividend itself, so future dates for VOO are just estimates. Reference data for SPY and IVV dividends can be found here.
| Ticker | Next Ex-dividend | Next Pay Date | March 2026 | June 2026 Dividend |
| SPY | 19-Jun-26 | 30-Jan-2026 | $1.797 | $1.62 (est) |
| IVV | 17-Jun-26 | 21-Jun-26 | $1.78 | $1.75 (est) |
| VOO | 25-Jun-26 (est) | 28-Jun-26 (est) | $1.87 | $1.88 (est) |
You only have to buy a stock or ETF the day prior to its ex-dividend date to be eligible for the dividend. You can sell on the ex-dividend date if you want and still collect the dividend when the distribution/pay date arrives. Be aware that in a flat market, the stock or ETF at market open on its ex-dividend date will typically drop in value by the dividend amount. See Top 10 questions on Dividends if you have more questions.
SPY, IVV, VOO 2025 Ex-Dividend Dates
| Ticker | Q1 | Q2 | Q3 | Q4 | |
| SPY | 15-Mar-25 | 21-Jun-25 | 20-Sep-25 | 19-Dec-25 | |
| IVV | 21-Mar-25 | 11-Jun-25 | 25-Sep-25 | 17-Dec-25 | |
| VOO | 22-Mar-25 | 30-Jun-25 | 25-Sep-25 | 23-Dec-25 (est) |
Pay/Distribution Dates
| Q1 | Q2 | Q3 | Q4 | Potential Cap Gains | |
| SPY | 30-Apr-25 | 31-Jul-25 | 31-Oct-25 | 30-Jan-26 | 31-Jan-26 |
| IVV | 27-Mar-25 | 17-Jun-25 | 1-Oct-25 | 23-Dec-25 | 3-Jan-26 |
| VOO | 27-Mar-25 | 2-July-25 | 1-Oct-25 | 26-Dec-24 (est) |
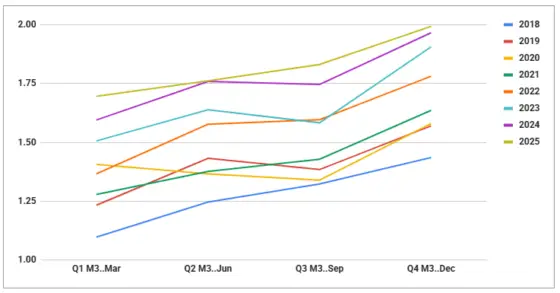
For more information about ex-dividend and distribution dates for SPDR, iShares, Schwab, and Vanguard ETFs see this post. See the chart below for SPY’s dividend history since 2018.

Updated 10-Dec-2025
Why 14.5 is the right PE ratio for the S&P 500
Interested in SPY dividend capture?
No biggie but I think you meant March 21, 2025 (not 2024) in today’s SPY (and related) ex-dividend post.
~Joe
Thanks Joe, much appreciated! I had fixed that but apparently didn’t save that revision.
Best Regards, Vance
Vance,
Thanks so much for always taking the time to do the SPY/IVV/VOO divi estimates. I always find them useful, especially when I am sitting on ITM SPY calls. Much appreciated!
Best,
Joe
Hi Joe,
You’re welcome! Nice to hear that it’s useful. Better accuracy than usual this time, 1.595 actual vs 1.6 predicted…
Best Regards,
Vance
Hey Vance,
A bit of a follow up. In my original post I neglected to mention they were short SPY calls. So here is something I am noticing out there and I hope you could briefly comment (verify or correct my observation) it has to do with an old quick rule-of-thumb useful in determining early assignment risk around short calls in dividend paying stocks (in this case SPY). Following is my view: Prior to 2022 we have had an incredibly low interest rate environment and in that low interest rate environment the effects on interest rates had remained fairly muted and the extrinsic values on calls vs puts have tended to be closer to each other. Coming into the past year or so with much higher risk-free rates the effects have forced intrinsic values to diverge noticeably. As a result put premiums have compresses and call premiums have expanded (as to be expected from the pricing factors of options). In the low rate environment if we wanted to check for early assignment risk of an ITM short call we could have looked at the put-side premium (OTM and all extrinsic) to get a quick idea of the corresponding calls extrinsic value. But currently that doesn’t work so well anymore as calls staring with about a week to expiry start showing greater extrinsic than their corresponding puts and that difference widens with time-to-expiration. As recently as March 7, 2024 TD Ameritrade (amongst other brokerages) is still stating the following:
=======
According to put-call parity, a put and a call of the same strike and expiration date will have roughly the same amount of extrinsic value. So a simple way to see if you might be assigned on that short call is to look at the corresponding strike and price of the put.
Again, any option that has an extrinsic value of less than the amount of the dividend might be a candidate for early exercise. So if a trader is short an ITM call and the strike’s corresponding put is trading for less than the upcoming dividend, they’re more likely to be assigned.
=====
I believe this is no longer a very useful approach given the divergence in extrinsic between puts and call and as a consequence intervening on short calls where you would other wise not want to prior to ex-div would result.
I’m hoping you can comment a bit on this.
Thanks,
Joe
Hi Joe,
Briefly, I don’t think the inflated premiums of short term calls near ex-dividend dates has anything to do with interest rates. The amount of time involved is just too short. What I think drives this is the market’s recognition that a stock’s price, at least at open will likely drop near the dividend amount from the previous close. Obviously there are uncertainties like the overall market moves and the amount of the dividend (although I think institutions can generate pretty accurate estimates, the only unpredictable variable is the shares outstanding at the ex-dividend point). The premium of these ITM and ATM calls is adjusted so that there is no free lunch in selling these calls before an ex-dividend event. An event with known timing that will drop the value of the stock. The actual assignment mechanism, right before ex-dividend looks rigged to me. There are very high volumes of option trades generated at those points. I think what happens is two group decide to cooperate, one side shorting a lot of calls and another side, buying and exercising a lot of calls. Because they are large compared to the open interest they have a high chance of exercising the existing open interest of the options, grabbing stock away from those accounts and collecting the dividend also. — Vance
Anyone else feel like the broad market dividend raises have been lackluster so far this year? I’ve been hearing companies have been raising their dividend pretty healthily this past quarter, so I wonder what gives. Thanks for the dividend updates!
Wondering when this might be updated for the 6/18/21 dividend.
The current version of the post already has an estimate for 18-Jun-2021. It’s 1.46 per share.
Vance
IVV went ex on Dec 13, 2022 for $1.723616
Thanks!
Hello Vance,
I purchased few shares of VOO on March 19, 2021 based on your ex-dividend information.
Hopefully I can receive VOO’s dividend
Yes, you will be eligible for the March dividend. VOO has not yet gone ex-div as of the 21st.
Any idea when Vanguard’s VOO goes ex dividend? As of today they still have not posted the March 2021 payment or dates on their web site.
https://investor.vanguard.com/etf/profile/distributions/voo
Always appreciate your updates.
Regards,
Bob
Hi Bob, They really are secretive about this. I had guessed the 11th but that’s come and gone. Probably will be around March 18th.
— Vance
Finally Vanguard posted VOO dividend info.
$1.2625/share.
Ex-date Mar-26.
Rec-date Mar-29.
Pay-date Mar-31.
Thanks! They seem to use a random number generator to figure out their ex-div dates…
Hi,
Thanks for the sharing. When will update the 2021 Ex-Dividend Dates?
Thank you so much.
I will probably update in the next couple of weeks. Info isn’t officially available yet, but for 2021 should be March 19, June 18, Sept 17 & Dec 17th for Spy dividend.
Hi Vance,
You article help me to sell S&P500 ETFs position before ex-dividend date.
Coz, I have to pay a tax of 30% income tax on dividend in US Market, so I need to sell S&P500 ETFs position before ex-dividend date and buy another S&P500 ETF(If VOO will ex-dividend and SPY was ex-dividend that sell all of VOO to buy SPY) immediately to avoid the income tax.
Many thanks!
Glad it was helpful!
Vance
Hi Zac. Be careful…if you sell the S&P 500 ETF then you will owe tax on the gain. if this is short term gain (held less than one year) then you’ll owe the tax (at income tax rates) for the whole realized gain. Also, the price of the stock is decreased by the amount of the dividend. I would strongly suggest you consult with a tax advisor before you make this stock move.
Thanks, Vance for this article…I have found this info to be hard to find in one location.
Hi Matt,
Thank you for the reminder. Actually, I’m NRA(Non-Resident Alien), don’t need to pay the income tax.
Thanks a lot!
Very informative article.
With the decrease in the underlying value of the SPY when a dividend is issued, do the authorized participants whose obligation it is to keep the SPY within range of the SPX step in and offset the drop occurred during the dividend? Or is this drop observed during the dividend still negligible enough for the SPY to maintain an acceptable range of the SPX and not necessitate the step of destroying shares to keep prices on target?
Thanks.
Hi Thomas, When SPY goes ex-dividend its theoretical value drops by the dividend amount because the cash that the fund was holding is now owned by the shareholders rather than being held by the fund. The value that it falls to is equivalent to the SPX value at that point. Over the course of a quarter SPY develops a premium relative to SPX because of this. The ex-dividend event occurs outside of normal trading hours so the APs are not active in managing the differential between the SPY & the SPX value. Because of the very large and liquid SPX futures and SPY markets any premium or discount between the two gets arbitraged out very quickly by institutional players.
Best Regards, Vance
The SPY dividend delay is so unethical. They steal part of your investment for 6 weeks and then give it back to you. Disgusting!
There’s a wrong word in the following sentence (December) at the start of the article.
SPY went ex-dividend Friday, Dividend 15th, 2017
Thank you for this blog. I have referred to it often for several years as I have learned.
So, Im certain someone else has thought of this, so the market has sucked all the efficiency and reward from it, but…
If one’s account is able through margin and swift trades, could one hop from one dividend to another in the major SPY/VOO/IVV indexes?
Or is there some variability in price action hopping from SPY to VOO to IVV that negates all additional dividend captures?
It seems too good to be true. To own XXX shares of SPY, and then ex-div sell and buy immediately VOO or IVV to capture that dividend. And provided the sell price is higher, (not necessary), sell and rebuy the SPY for next dividend?
Thoughts?
Hi Frogger, When a stock goes ex-dividend it is essentially a zero-sum game, the stock drops at open by the amount of the dividend–so there is nothing free to be gained. That drop is pretty noisy, the dynamics of the market often disguise it but I think a consistent practice of doing this would end up worse than neutral.
If you regularly short options on your stock/ETF, be aware that the counter-party could exercise the options to be assigned the shares. This way of acquiring shares also makes the new owner eligible to receive the dividend.
My account’s functionality is limited so I can’t see when my shorted options have been exercised so I don’t know if I am receiving the dividend or not.
The stock may appear in your account on the same day, but the settlement date is in the future so you need to buy it a few days before the ex-dividend date. Not just the day before.
Sorry Annie, not true. The record date is 2 business days after the ex-dividend date so stocks purchased the day before the ex-dividend date have met the T-3 day requirement for settlement and are eligible for the dividend.
Thank you for correcting the information.
Above you said “You can sell on the ex-dividend date if you want and still collect the dividend when the distribution / pay date arrives.” Don’t you have to hold through the record date which is typically around 4 days after the x-div date?
No. With the T+3 settlement process (which is going to become T+2 in September 2017) Shares that are purchased before the ex-dividend date are still officially owned by you on the record date–which is the date that matters. The record date is 2 business days past the ex-dividend date.
Hi Vance,
I was notified that on September 5, 2017, the timeline for equity trade settlement will be reduced from three business days after the trade date (“T+3”) to two business days after the trade date (“T+2”). Does it mean that from now on a person who purchases shares (such as SPY) exactly on the ex-dividend day will get the dividend?
Thank you so much!
Hi Leonardo, The change to T+2 changes the “record” date to be a day earlier than before, but you still have to buy the stock the day before the ex-dividend date to received the dividend.
Vance
Hi Vance,
Thank you for straightening it out!
I have searched many places and this is the only site that covers the tips for ex-dividend trade. I thank you for creating this forum!
Since the underlying ETF (e.g., SPY) will typically drop on the ex-dividend day as you pointed out, how about we buy a lot of SPY put options the day before (long-dated puts) and close them on the ex-dividend day? Will that be profitable?
Thank you again!
Leo
I’m seeing some data which indicates the SPY dividend could be as high as $1.38 per share. We’ll know soon enough.
IVV dividends of $0.99 for June 2016 – What happened?
The article says the ex-dividend is Friday May 17, 2016. Is that a typo? Did you mean June 17th, 2016?
Sorry. Should have been been June. Fixed. Thanks!
Why is there a potential date for the SPY ex dividend of 27th December? Is there a possibility it’s not the 20th? Thanks.
The 27th is a potential capital gains distribution. Very unlikely. The 20th is definitely the regular ex-div date.
–Vance
anybody have a good estimate for the SPY dividend for the Q4?
Hi Jason, Don’t know how accurate you need to be. Based on historical data / trends I’m estimating $0.84 per share.
— Vance
Thanks, needed to know the divy, and this was the only place I could find it!
Thanks for your informative article.
I was told by the representative at SPDR that the SPY ex dividend date for March 2011 is the 18th. The 19th is a Saturday.
Hi Ray,
Thank you very much for giving me the heads up. I have corrected my information.
— Vance