It’s well known that long volatility Exchange Traded Products (ETPs) like VXX, UVXY, and UVIX often experience devastating losses during market quiet spells—even when the value of the VIX is staying relatively stable. These heavy losses occur when the VIX futures that underlie these funds are in a price/time arrangement called contango. The chart below shows an example of VIX futures in a contango configuration.
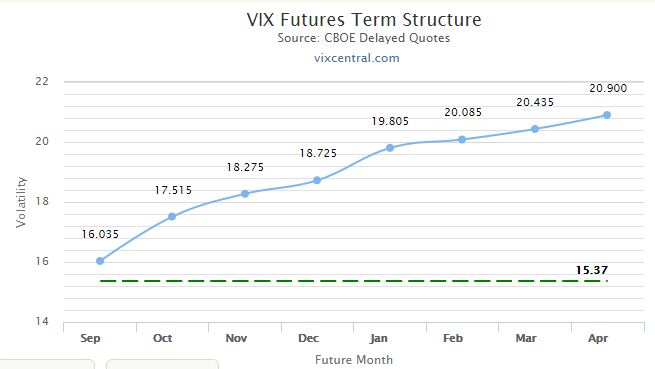
The blue dots show the prices of various futures and the horizontal scale indicates the month of expiration. The horizontal green line shows the current VIX price— also known as the “spot” price. You can’t tell it from the chart, but in this example, the leftmost future has 4 days until expiration. At expiration, a VIX future’s value will be very close to the VIX spot price.
When futures are in contango the longer the future has until expiration the higher its price.
If you were to take a time-lapse video of this chart over time with a stable VIX you would see the blue dots moving down the blue line, eventually intersecting with the green VIX line at expiration.
Volatility Exchange Traded Funds Roll Futures
In contrast to VIX futures contracts, volatility ETPs don’t expire; instead, they hold a mix of VIX futures (the two leftmost ones for VXX, UVXY, and UVIX) that’s adjusted every day in order to keep the average time to expiration of the portfolio at 30 days. In this daily transaction some of the leftmost, next-to-expire futures (I’ll call them M1), are sold and longer-dated futures (M2) are purchased. In futures parlance, this is called a “roll.” When the M1 futures expire all the M2 futures become M1 and the roll process starts selling the futures with that expiration date rather than accumulating them.
When the futures are in contango it’s bad news for the price of the ETPs holding them. They are buying futures when they are higher on the curve, at a more expensive price, and selling them when they have decayed to a lower price. Buying high and selling low—not a profitable practice.
The Daily Roll Does Not Reduce the ETP’s Value
There’s a widespread misconception that the roll process itself is the cause of the ETP price erosion—after all, you are buying high and selling low. But the roll is not the reason the ETP’s price erodes.
Saying that the roll is the cause is equivalent to saying that selling your old, depreciated car to the dealer and buying a new one is the reason your car dropped in value. Of course, everyone knows that your car dropped in value as it aged, and this is also the case for VIX futures in contango. The transactions just shift the depreciation process to a different vehicle.
The buy-high, sell low aspects of the VIX futures contract roll process is a symptom, not a cause.
You might think this is a harmless misunderstanding, and in the grand scheme of things it is trivial, but that doesn’t mean it can’t leave a trail of confusion in its path.
For example, what happens if M1 and M2 stay stable at 17.6 and 18.45 for a couple of days? If the roll causes decay then we would expect the price of VXX to drop as it sells M1 contracts and buys more expensive M2 contracts—but it doesn’t, as the detailed example later in this post shows.
I used to accept the daily roll explanation for the decay of the long volatility ETPs, but once I did the math it didn’t add up. The reality is that when the VIX futures are in contango both M1 and M2 tend to drop down towards the VIX price over time. Given that, it’s not surprising that the long volatility funds that hold these futures tend to drop in price. The next section shows analytically that the daily roll has nothing to do with the decline—it’s a value-neutral operation.
A Detailed Analysis of VXX’s Cost of Contango
A few years ago I developed a consolidated spreadsheet to organize historic VIX futures data from the CBOE into a single spreadsheet. Using this spreadsheet I calculated the short (SPVXSTR) and medium term (SPVXMTR) rolling indexes that underlie the various volatility Exchange Traded Products (ETP) like VXX, UVXY, SVXY, and VXZ. The image below shows a small sample comparing my calculations (M1-M2 Short Term Rolling Index) with the official value of the short term index.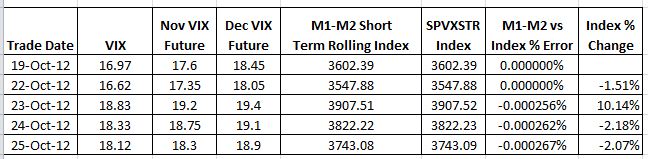
The percentage differences between my index and the official index (e.g., -0.000256%) aren’t cumulative and are probably due to rounding.
Once I verified my index calculations I wanted to look at the nemesis of the long volatility funds like VXX and UVXY—yield losses. These losses, which can be 5% to 10% per month, occur when the CBOE S&P 500 Volatility Index (VIX) Futures that underlie these ETPs are more expensive than the market, or “spot” price.
I wanted to quantify this loss with my spreadsheet without the noise of everyday volatility moves, so I left the term structure in contango but held the futures prices constant in my spreadsheet from day to day as an experiment. The results were surprising.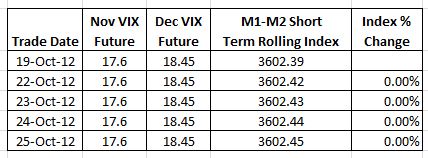
My calculations showed no daily roll costs in the index. The 0.01 upticks in the index are due to Treasury bill interest. Of course, having the futures fixed like this is not a realistic situation—as futures near expiration they usually move closer to the spot price. But the example proves that the specific roll mechanism specified by the index and followed by ETF issuers does not decrease the value of the index on a day to day basis.
The usual explanation for roll costs, discredited in the sample above, asserts that losses are incurred when funds sell cheaper shorter term contracts and buy more expensive longer-term contracts every day as specified by the indexes they follow—a sell low, buy high situation. A closer look illustrates the flaw in this explanation. Suppose you have a $10 million position after market close— after the contract rolls. Fractional contracts aren’t supported, so the unused money goes in the cash bucket.
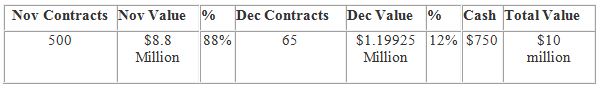
The next table shows the positions at the end of the next day, neglecting transaction costs and interest, and assuming no change in the futures values.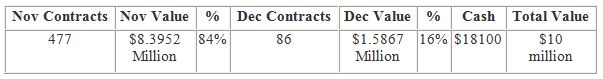
The number of contracts changes, but the total value doesn’t.
There’s no doubt that these indexes lose money when the VIX Futures term structure is in contango—so where do the losses come from?
The chart below shows the real root cause:
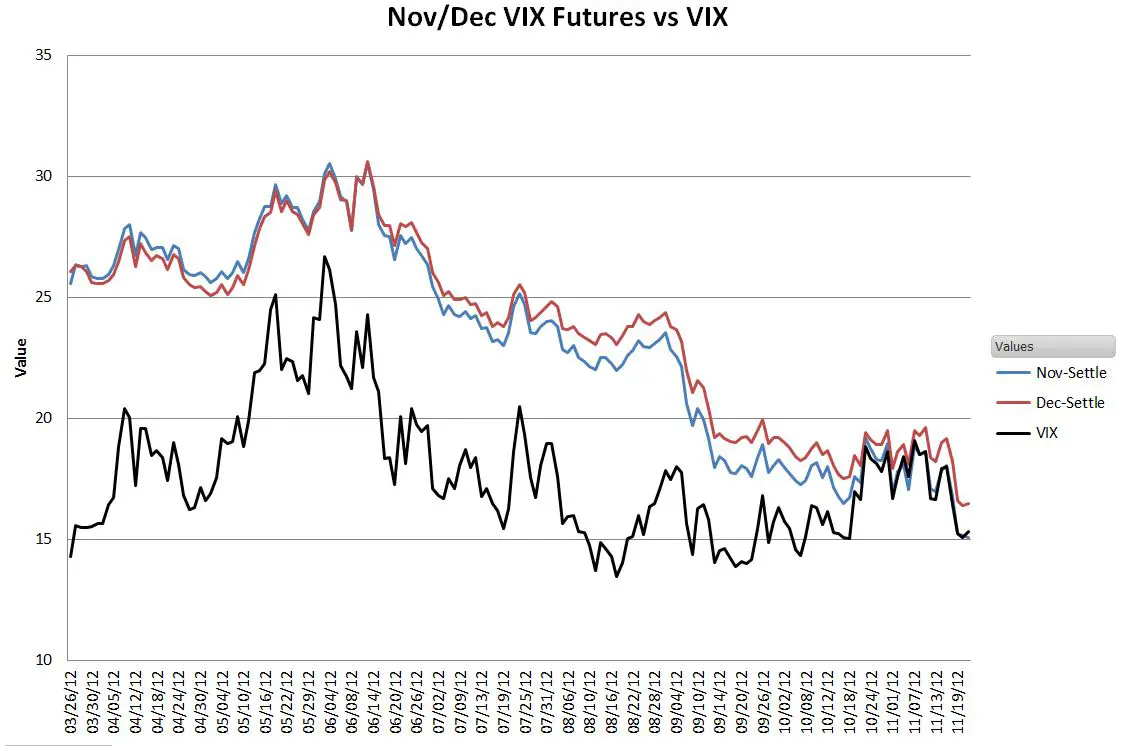
Plotting the actual 2012 November and December VIX futures values during a period of contango vs the Cboe’s VIX®, we see that both contracts decline in value over time, eventually converging with the “spot” VIX price at their expiration. With both sets of contracts held by the long volatility funds generally declining it’s not surprising the overall value drops. Since we are typically looking at term structures over the span of multiple months, the small daily “slide” down the curve isn’t noticeable, especially when obscured by the up and down moves in volatility driven by daily stock market fluctuations.
This analysis also explains why the mid-term volatility index SPVXMTR which holds contracts that are 4 to 7 months out also declines in contango situations, even though 2/3rds of the contracts (M5 & M6) aren’t rolled on a day to day basis.
Volatility Futures aren’t always in contango. If the markets are panicky enough the futures contracts get less expensive than the VIX index. The chart below from VIX Central shows the June 10, 2010 situation when the VIX index closed at 36.57.
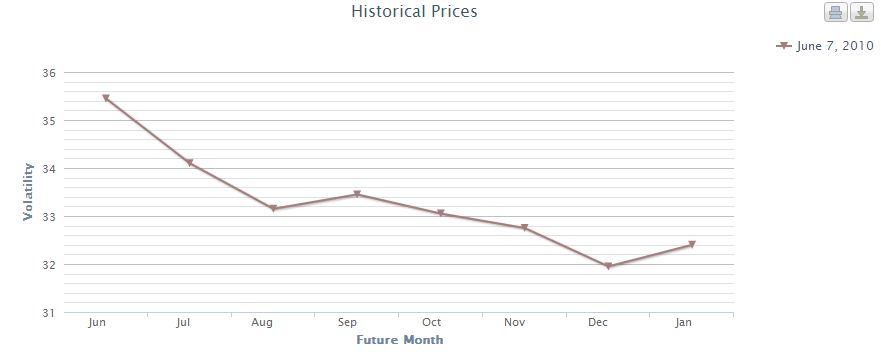
In this configuration, called backwardation, the long volatility funds have the wind at their backs, every day the futures they hold are sliding up the curve, getting closer to the spot price.
Knowing the real reason for term structure based losses/gains hasn’t changed my volatility investment strategy, but it has removed one source of confusion in understanding the daily moves.
Dear Vance,
Please accept my sincere appreciation for the invaluable information you share on this platform. Your ability to simplify complex technical concepts into easy-to-understand examples is truly remarkable.
I have personally learned so much from your work, and I am grateful for the effort you put into making these topics accessible to others.
With all due respect, I feel compelled to express my concern regarding your contango calculation, which contradicts even your own explanation of the LONGVOL/SHORTVOL methodology.
Please revisit the formula for PDR, and consider a scenario where M1 (VFTW1) < M2 (VFTW2) and these remain unchanged for one day. That day, based only on the passage of time, the weight has shifted aprox. 4.76% from M1 towards M2, resulting in the constant maturity contract (CW) gaining 4.76% of the difference between M1 and M2.
The same logic should also apply to your example on this page. And it does; the Cash bucket is no other than the daily loss due to contango. It is the corresponding 4% (the daily increment in this example) of the percentage difference between M1 and M2.
I wanted to share my perspective in the spirit of constructive feedback.
Best regards
George Hategan
Hi George, Thanks for the feedback, I appreciate it.
Regarding losses due to contango, there is no question there are losses, the controversial point is what causes it. I think it is clearest when you look at it from an operational standpoint of the ETF. Let’s say an unleveraged long fund has assets worth $100 million near the end of a trading day, let’s say $70M worth of VIX M1 front month contracts and $30M in M2 contracts. At the end of each trading day they need to shift ~4.76% of the fund’s total assets from M1 contracts to M2 contracts. In this case they will sell ~$4.76 million worth of M1 contracts and buy ~$4.76 million worth of M2 contracts. If the term structure is in contango, as it often is, then they will end up buying fewer M2 contracts than the number of M1 contracts they sold, but this has no economic impact (other than small losses due to commissions, fees, and bid/ask spreads. The value of the ETF will still be ~ $100M. The ETF is not graded on the number of contracts it holds, it’s the asset value that counts. The constant maturity future is a useful metric from a term structure standpoint, but it does not capture the operational realities of a VIX volatility ETF roll process.
If you want to get analytic about it, you can look at the time period in late 2020 when the VIX futures term structure was distorted by the 2020 election event risk. The November futures were very expensive relative to the October futures, but unlike normal contango term structures the Oct & Nov VIX futures prices were staying stable over time, the VIX was rising rather than the futures declining. If rolling contracts caused contango losses then this would have been a period of heavy contango loses in long VIX ETPs like VXX, but since the actual futures were not dropping in value the value of the VXX & VIXY held up well during that period. Best Regards, Vance
Best Regards, Vance
Hi Vance,
“..then they will end up buying fewer M2 contracts than the number of M1 contracts they sold, but this has no economic impact .. ..The value of the ETF will still be ~ $100M.”
This does not sound right to me 😉 What you are referring to as “the value”, that is a cost. The real value is the notional value of your contracts. If you end up buying fewer contracts while your overall investment remains the same, that will ultimately result in a loss. For every daily roll, you are decimating your position, and the rate of that is precisely the contango.
Best regards
George
Hi George,
It’s likely this will be a topic we will need to agree to disagree on. You’re not alone in being convinced that the daily contract roll in volatility ETPs itself causes contango losses
My position
1. I implemented the equations exactly as they are in the prospectuses
2. In a test case my calculations show no losses in NAV for daily rolls, even when M1 is less than M2 https://www.sixfigureinvesting.com/2016/09/the-cost-of-contango-its-not-the-daily-roll/#no-change
3. I have spreadsheet products that use my calculations, based just on futures prices, contract durations, treasury yields, fees, operating costs, starting at inception dates of VXX, UVXY, UVIX, SVIX, etc predict NAV prices. The number of contracts held by the ETP is not a factor in these calculations.
My results match the issuers’ published NAV prices within a percent or two.
Best Regards,
Vance
Hi Vance,
The UXVY(Long VIX future ETF) deciles in value dramatically per year due to what you explained in this article. And by contrast SVXY(Short VIX futures ETF – Inverse ETF) increases in value dramatically. This seems indeed to be structural for VIX ETFs.
Why does this not apply(or for far smaller extend) for Crude oil futures ETFs, Gold futures ETFs or for most other commodities? They also have a contango futures market.
Also UVXY has very much reverse split to keep sharply decreasing prices in reasonable trading range and SVXY have a lot of splits for their increasing prices to keep their trading prices also reasonable. For example Gold ETFs, Crude Oil ETFs or Gas ETFs have also far less of splits/reverse-splits.
In other words what is so different with the VIX futures ETFs? Why are the roll yields more effecting their prices?
Kind regards,
Kadir
Hello Vance….hope you are doing well. What are your thoughts on shorting Vxz instead of shorting vxx. In terms of opportunities and risk management. Any advice is appreciated. Thanks
Vance,
In your opinion is the contango effect the reason why long ETP’s like UVXY have lost over 95% of their value in the past few years? Or is the market discounting that the contango will remain in place to infinity or for a very long period of time? It seems to me that the cost of that contango is roughly the same from month to month and thus the ETP’s would decline in a more linear fashion instead of taking dramatic plunges. I know hedge funds are selling any long volatility product they can as a way to generate income which puts them under additional pressure. Do you feel there is a price floor for these products or will they just continue to lose value as long as contango is in effect?
Hi Mike, The losses are structural. The VIX Futures that the long volatility funds hold are in a contango term structure (long term futures more expensive that shorter term futures & spot) 75% or more of the time. These funds will continue declining as long as the futures are in contango. In addition to contango the VIX futures will sometimes shift up or down pretty much in unison, which leads to the more dramatic moves.
Vance
Hi Vance,
The UXVY(Long VIX future ETF) deciles in value dramatically per year due to what you explained in this article. And by contrast SVXY(Short VIX futures ETF – Inverse ETF) increases in value dramatically. This seems indeed to be structural for VIX ETFs.
Why does this not apply(or for far smaller extend) for Crude oil futures ETFs, Gold futures ETFs for most other commodities? They also have a contango futures market.
In other words what is so different with the VIX futures ETFs?
Kind regards,
Kadir
Above is confusing in the way it shows obvious. Above, doesn’t take into account that there are opposite sides of transactions. While long ETNs (VXX,UVXY) are selling M1 and buying M2, short ETNs(XIV) are doing the opposite: buying back M1 and selling M2. If they are properly balanced in volume then “roll process itself is NOT the cause of the ETP price erosion”. However, if they are not then roll does influence erosion/slippage.
Hi Vance,
Was just wondering if long volatility funds still loses value when the vix futures curve is in backwardation, but have a spot vix lower then the vix futures curve on expiry. The current vix futures curve can be used as an illustration. Appreciate your expertise on this topic.
you don’t lose any money if you sell you 10 $1000 cars and buy 1 $10000 car, that what daily roll is. BUT a $10000 car depreciates faster than 10 $1000 car in the future.
In the case of cars I agree with you, but with VIX futures the contracts that you’re rolling to are actually decreasing in value slower than the contracts you’re rolling out of (assuming the term structure is in contango). The decay towards spot value is particularly high when there’s a week or two left before the contract expires.
If VXX’s movement is solely tied to mo 1 and mo 2, why is VXX only down .82% and the Dec futures down 1.65% and Jan futures down .80%?. Conversely I have seen days where VXX is down and both M1 and M2 are up.
Hi Greenlander, Most/all of the on-line brokers use the wrong closing time for their VXX quotes. VXX”s final quote is driven by the VIX futures settlement time which is is around 4:15PM. For more see https://www.sixfigureinvesting.com/2013/03/is-etf-etn-broken/
— Vance
“daily roll” doesn’t mean the physical act of rolling a tiny bit of your position from M1 to M2, it means the the cost of roll down, or the roll yield of your entire position, as the contangoed futures converge to spot.
So yes, you are correct, but I hope that most people trading these knew that already.
What are backwardation indicators besides futures cheaper than spot ?
Also is it better to purchase let’s say TVIX day closer to expiration?
Hmmm… it looks like you have not understood that holding futures is not like changing cars. When you hold a future contract, you hold a bet that pays off a certain amount per volatility point. By rolling forward you need to pay more to get the same exposure to one volatility point.
Hi Robert, I certainly get that when in contango the further out future is going to cost more. The point of the article is the roll itself is a value neutral event.
It is not neutral “per volatility point”. To get the same exposure to volatility you need to put more money on the table. There is a combined effect. Convergence to VIX and rate of convergence. A plain investment in the front month contract will not return as much as a continuously rolled position from the front to the second contract will.
Robert pleaae site an example
Roll event is what newbie investors assume decay is ?am I
correct in the point your making?
Thanks Vance.
Am I correct that in your last example (backwardation) in order for your logic behind the backwind to work there should be spot VIX higher than M1 and M2?
Hi Ardbeg, As you suggest, normally when the VIX futures are in backwardation VIX will be higher than the futures, and the long ETP will be boosted. However, I have seen situations where the VIX has dropped after a market scare and the VIX futures are higher than the VIX and still in backwardation. In this configuration there’s a high risk of the futures dropping rapidly in value.
Hi Vance,
Thanks for the explanation.
Now just to summarize my understanding of the article’s concept: regardless of M1/M2 relation (backwardation or contango) only the value of VIX spot relative to values of M1 and M2 matters. When the spot is higher than the futures then (generally) it’s a backwind for long ETPs and if it’s lower then it is a tailwind. Do I see it correctly? If so, then this bizarrely negates the basic concept of backwardation/contango importance in VIX products’ trading… Not that I am complaining if this works). Thanks again.
I wouldn’t say it negates the concepts of backwardation / contango, I just think the convergence to spot is a more fundamental root cause. The term structure generally is a very good predictor of what to expect.
The term structure is good indicator of backwardation/ contango a few days out from exp?
Hi Vance, did I understand you correctly?
9/13 vix was lower than the previous day but UVXY was higher than previous day
8/24 crash 2015, vix on 9/1 was lower than 8/24, but uvxy 9/1 was higher than 8/24 crash,
Nice! I’ve seen the light, it seems so obvious now. I’m seeing the descending futures in my head… 😉
Now, to the important part. What’s your volatility strategy?
When the market is choppy I see the vol ETPs as just highly leveraged S&P proxies. If volatility has spiked, either due to a correction or an event (e.g., Brexit, FOMC) then I like to take advantage of the volatility collapse afterward.
Do you figure daily contango decay per day by dividing it by calendar days (30) or trading days (20). So if contango is 20% it is either 1%/day for 20 days or less for 30 days?
No real standards on this, and the decay rate isn’t all that linear, it really accelerates in the last few dates before expiration. VIXcentral.com uses the M1 / M2 slope as the contango rate, which is reasonable, but you could also make a case that the M1 to VIX gap is a better measure. It certainly matters whether you are talking about an individual future or an ETP that is a mix of futures. In that case I have proposed a methodology for calculating monthly and yearly decay rates. https://www.sixfigureinvesting.com/2016/06/monthly-yearly-decay-rates-contago-losses-vxx-uvxy-vxx-vixy/
I prefer trading days myself over calendar days.
Thanks Vance, I was referring to UVXY which is a combo of M1/M2 weighted of course and I also think the M1/spot gap is critical to decay rate (not sure how to figure that into decay) but just wanted your input on a daily estimate of “tailwind” I am getting by shorting UVXY in contango.
I’ll take a look to see whether the difference between the appropriately weighted M1/M2 and the spot VIX divided by 30 gives a reasonable tailwind metric for funds like VXX, UVXY, & TVIX.
BTW, Thank’s a million, I have read everything in sixfigure and advise everyone study it before touching these ETN’s/F’s or they will be in for a surprise. Just need a good way to figure daily decay using contango (as listed by vixcentral) and/or M!/Spot gap. If there is a way of combining the two in a spreadsheet or an algorithm type calculator, that would be cool!
Vance (cool name btw) what is your strategy for inauguration? Vix futures down?