When I first saw a chart similar to the one below in Business Insider I was immediately suspicious. For example I knew that May through September of 2009 was a period of rapid growth (21%) yet that surge did not seem to show up on the bottom curve (green)—which shows the performance of staying in the market only May through September.
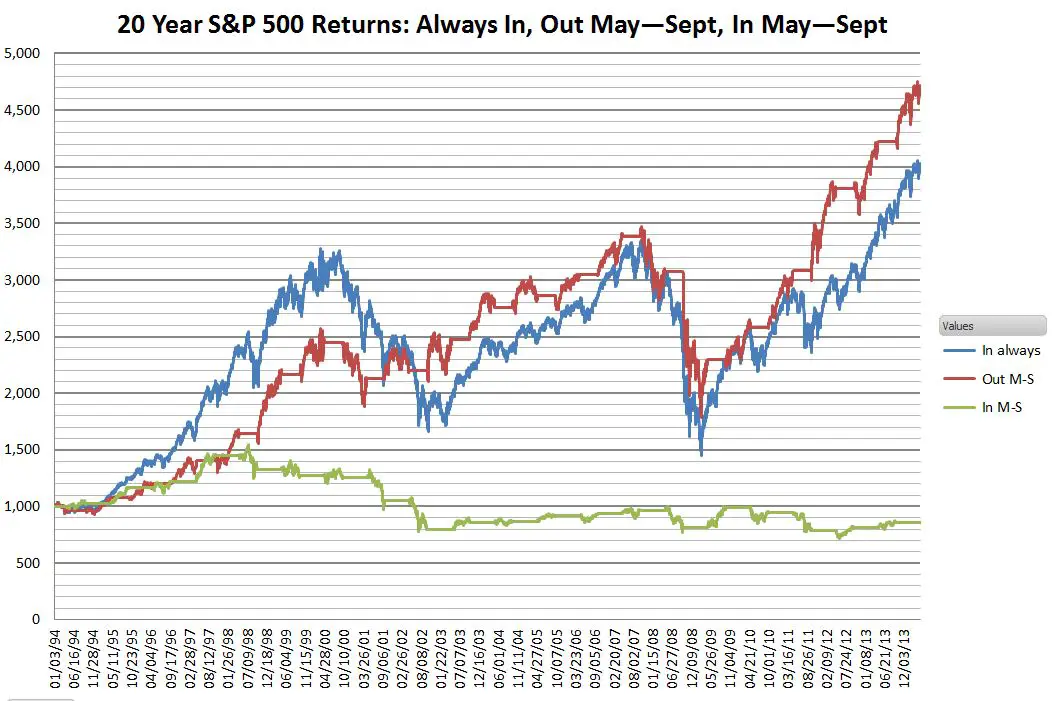
It turns out the 21% gain is there, it’s just on such a low basis ($815), that it’s dwarfed by the other curves on the chart (one of the dangers of a chart with linear vertical axis).
On my own analysis I didn’t include dividends nor did I factor in interest that could have been earned while out of the market. I think these two factors would roughly offset each other with the in/out strategies, and including dividends would have boosted the gains of the “always in” strategy.
I wondered about the choice of 1994 as a starting point in the original chart. A 20 year time frame is reasonable, and 1994 wasn’t a particularly eventful year, but I repeated the analysis with 63 years of S&P 500 data to see if it made a difference.
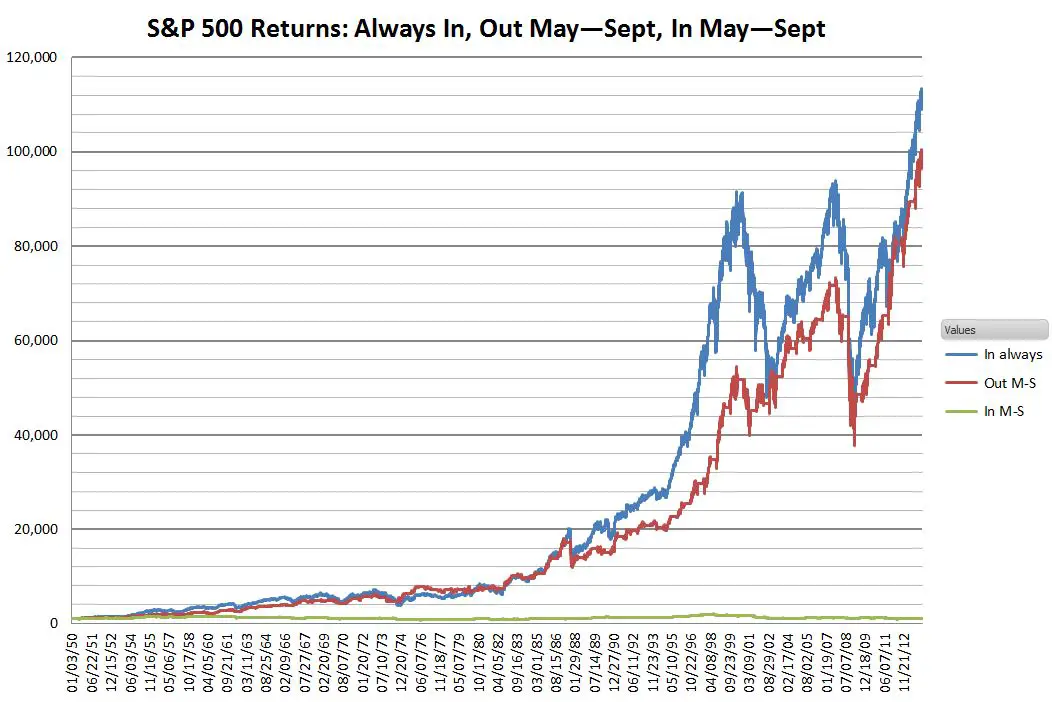
Over this time span the “Sell in May” strategy significantly lagged in the bull markets of the late nineties and 2002 to 2007, and catches up during the depths of the bear markets.
The hold May through September strategy is still a flat-liner. It’s hard to see how being in the market during that period helps the buy & hold strategy. A closer look at the yearly distributions yields the answer.
The chart below shows the distribution of the percentage gains/losses by year being invested only May through September.
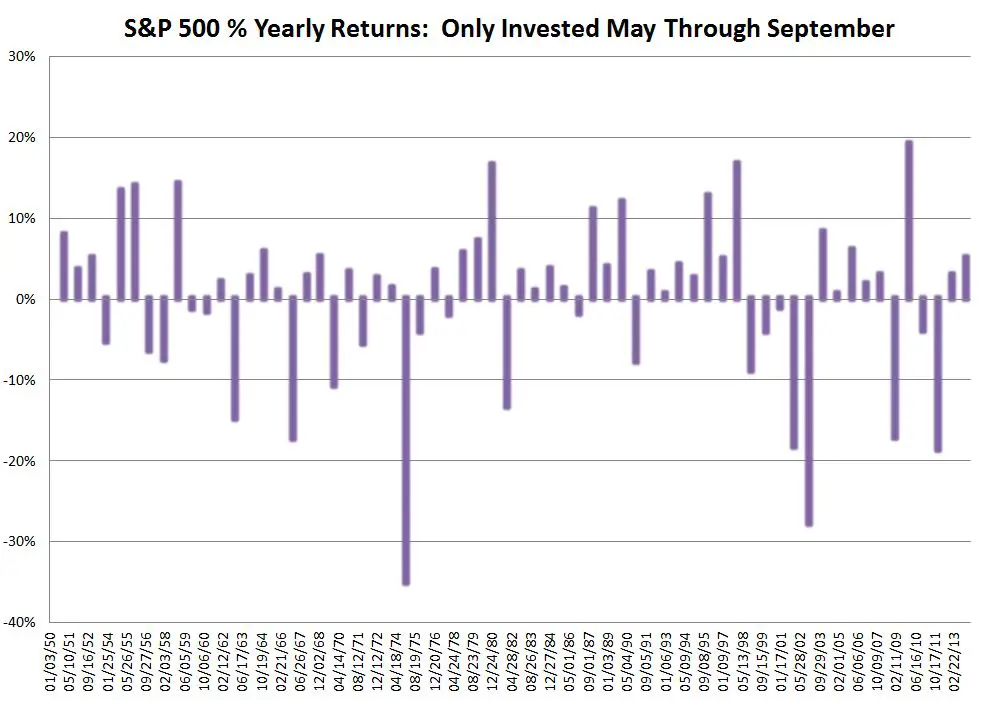
The average of all the returns is low—a paltry 0.33% yearly gain, but the number of up years out numbers the down years by almost two to one, 40 up years vs 23 down years.
The next chart adds the results (green bars) of being invested except for May through September.
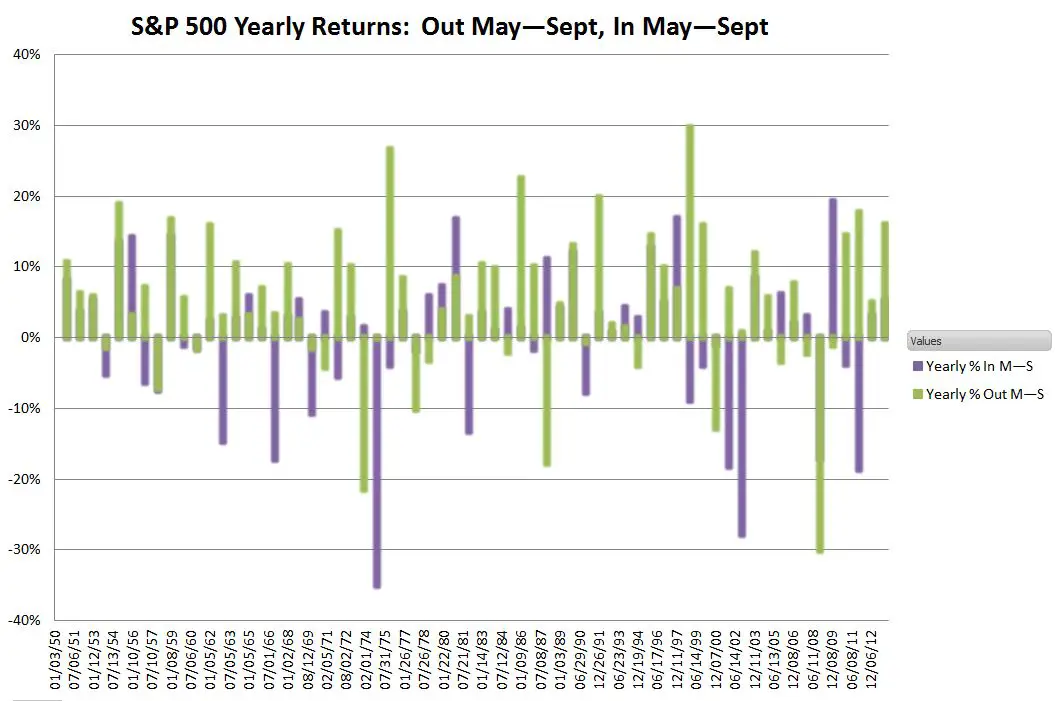
There were only 10 years during this 63 year period where losses during the May through September period weren’t more than offset by the returns from the rest of the year. And in 33 of those years both periods had gains—dramatically compounding the results. It’s this compounding effect that rewards the buy and hold investors.
This final chart shows the performance of the “Sell in May and Go Away” strategy with taxes included, assuming a 28% marginal tax rate.
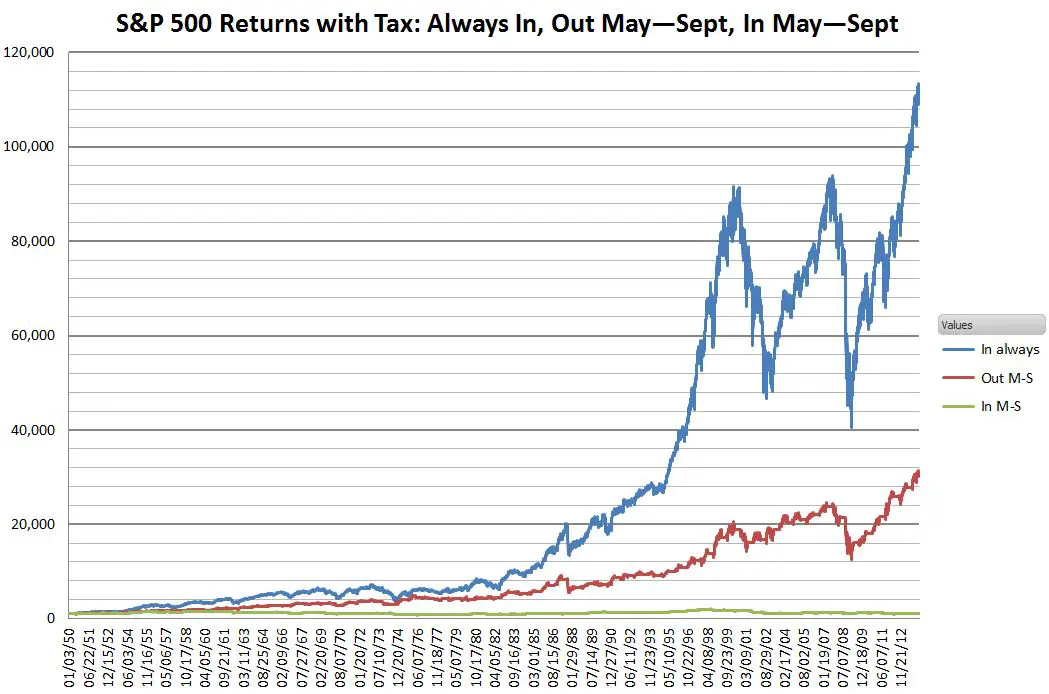
Since the strategy is never invested for a full year taxes on profits will always be at short term capital gains rates—typically the same as your marginal tax on income. Since you don’t have to pay taxes on gains until the year after you sell the security I assumed that the money earmarked to pay taxes was used for ongoing investment until early April of the next year. Losses were carried forward and used to reduce/ eliminate tax on latter gains.
Including taxes the results of the 63 year “Sell in May” strategy were hammered down 70%—from $100K down to $30K and the 20 year period takes a 30% haircut. So, unless your investments are in a tax protected account the historical performance of this strategy would have been abysmal. Even in non-taxable accounts the long term performance of “Sell in May” would have been inferior.
I think it’s best to stay away from “Sell in May”.
Very interesting post.
As someone who looks at a lot of track records and benchmarks, the first chart you showed (and criticised) suggests to me that the outperformance may all be down to one or two periods. Could you just divide one price series by the other, to get a relative line? Then it will be obvious if that is the case.
Hi John,
I divided the Out in May thru Sept portfolio by the In May thru Sept in the chart below. Not sure if this is what you meant. Seems to just reflect the effects of not being in the market 7 months of the year during bull markets.
— Vance
Thanks! I meant ratio of In-Always to Out-May-Sep.
Hi John,
In-Always divided by Out-May-Sept below. Nothing jumps out at me. Being out during the Fall of 2008/Spring 2009 was significant…
— Vance