Free Resources
- BITX, 2X leveraged Bitcoin backtest from 2014 Spreadsheet, supporting blog post How Does BITX Work
- Backtests: UVIX 2X VIX short term, SVIX -1X VIX short term, ZIVB -1X mid-term from 2005, supporting blog posts UVIX, SVIX, ZIVB
- Black & Scholes option equation in a single Excel cell spreadsheet with examples of how to expand that cell into parametric studies. Associated blog post Black & Scholes equation in a Single Excel Cell.
- Historic and future NYSE trade dates (through 2024), VIX monthly expiration dates, and SPX monthly option expiration dates, spreadsheet
- SHORTVOL & LONGVOL backtest, underlying indexes for SVIX & UVIX, Spreadsheet from 2005, supporting blogpost LONGVOL & SHORTVOL
The following services are available for purchase:
- Volatility ETP Price Projection Service
This service calculates future volatility Exchange Traded Product (ETP) prices for the next 70 trading days assuming the current VIX futures term structure is stable. It also projects the 1 sigma high and low price ranges over that same period using the historical volatility and trends of the last 40 trading days.
- Quarterly Spreadsheet Updates (for spreadsheets you have downloaded/purchased from Six Figure Investing)
The following spreadsheets are available for purchase (click the links below to get descriptions and ordering information)
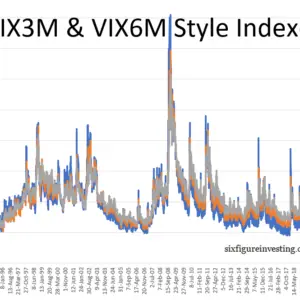
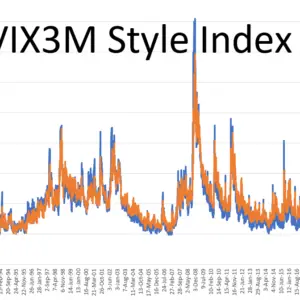
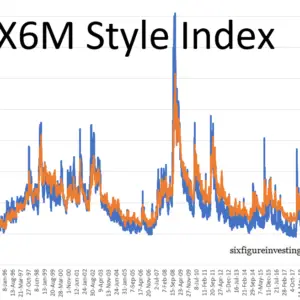
- VIX3M, VIX6M, VIX3M+VIX6M Index Style Calculations Back to 1990
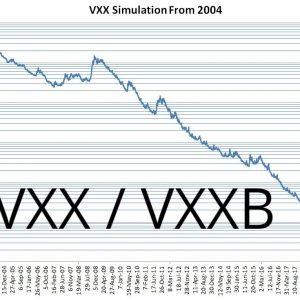
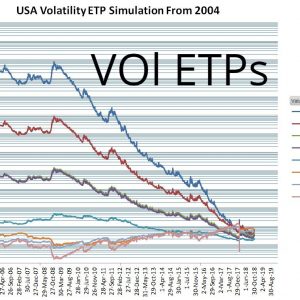
These spreadsheets use SPX option and USA treasury data together with the Cboe’s 93-Day VIX style calculation methodology to generate values back to January 2nd, 1990. - Backtests of Popular Long and Inverse Volatility ETPs (VXX, VIXY, XIV, SVXY, TVIX, UVXY, VXZ, ZIV) 2004 – Recent (See this table for specific dates).
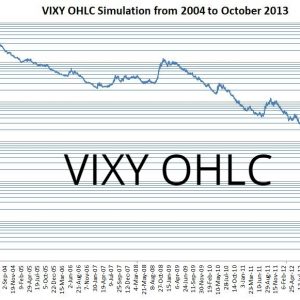
This family of spreadsheets uses the CBOE’s historical per month VIX futures data and historical treasury bill yields to synthesize the closing values of these popular ETNs and ETFs starting in March 2004. The annual fees for these funds are also included in the calculation. Click on this link for more information. For a backtest on VXX see Backtest of VXX Including Yearly Fees. - O/H/L/C Backtests of Popular Short Term Long and Inverse Volatility ETPs (VXX, VIXY, 1.5X UVXY, TVIX, XIV, -0.5X SVXY, VXZ, ZIV) including open, high, low, and close data 2004—Recent (See this table for specific dates) Also XIV, 2X UVXY & -1X SVXY 2004—2018)
This spreadsheet uses the CBOE’s historical per month VIX futures data and historical treasury bill yields to synthesize the open, high, low, and closing values of these popular ETNs and ETFs starting in March 2004. Click on this link for more information. - CBOE Volatility Index (VIX) Futures data 2004 – Recent (See this table for specific dates)
This spreadsheet uses the CBOE’s historical per month VIX futures data, starting in March 2004 to create a single uniform data set for the first through the seventh-month futures closing values for any given trading date. By bringing in the latest data you can update this spreadsheet to the current date. Click on this link for more information. - VIX Futures, ETP indexes (e.g. SPVXSTR & SPVXSP), and simulated ETP prices
This product includes two spreadsheets, one that assembles historic VIX futures values from March 2004 and computes the indexes that the most popular volatility Exchange Traded Products use (e.g, VXX, SVXY, UVXY, VXX, TVIX, ZIV). The other spreadsheet takes the index values and adds the ETP fees to simulate the Indicative Values (IV) for popular ETPs from 2004 until recent (see this table for specific dates). Both of these spreadsheets include the full data sets and required formulas.
-
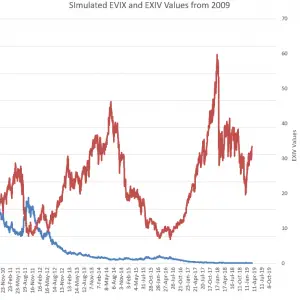
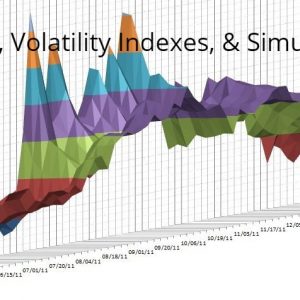
EVIX / EXIV Backtests
$99.00 Add to cart -
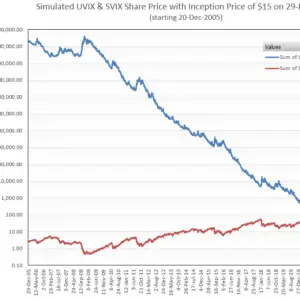
Volatility Shares -1X SVIX, 2X UVIX, and -1X ZVOL ETFs Backtest + Associated Indexes (free)
$0.00 Add to cart -
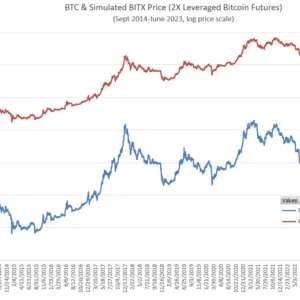
Volatility Shares BITX (2X Bitcoin Futures) & ETHU (2X Ether) ETF Backtests (free)
$0.00 Add to cart -
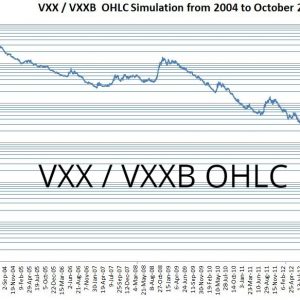
VXX Backtest
$29.00 Add to cart -
Volatility ETP Backtests
$99.00 Add to cart -
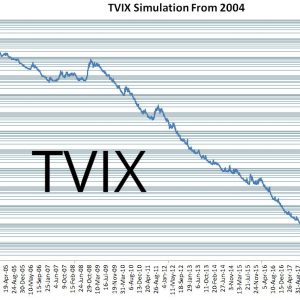
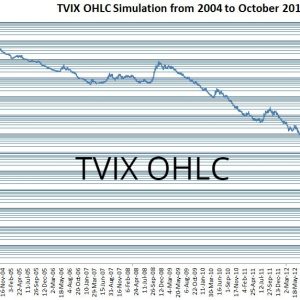
VelocityShares 2X TVIX Backtest
$29.00 Add to cart -
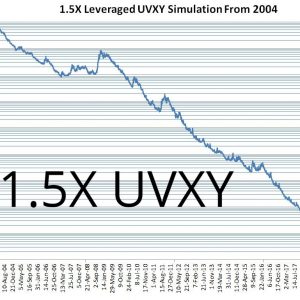
Proshares 1.5X UVXY Backtest
$29.00 Add to cart -
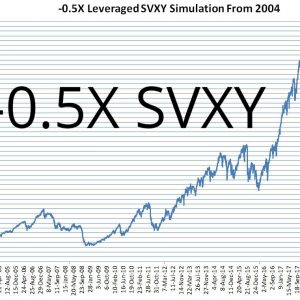
Proshares -0.5X SVXY Backtest
$29.00 Add to cart -
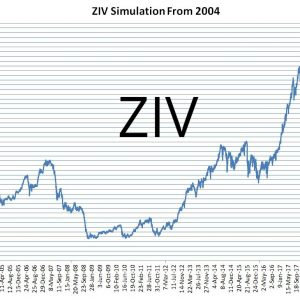
VelocityShares ZIV Backtest
$0.00 Add to cart -
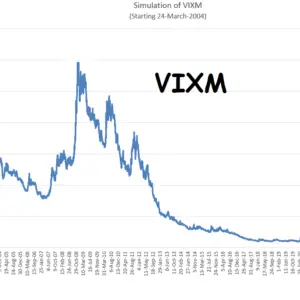
VIXM Backtest
$29.00 Add to cart -
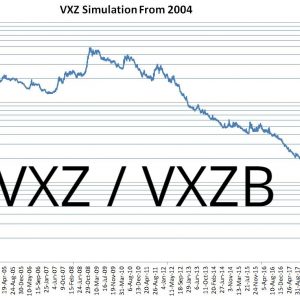
VXZ Backtest
$29.00 Add to cart -
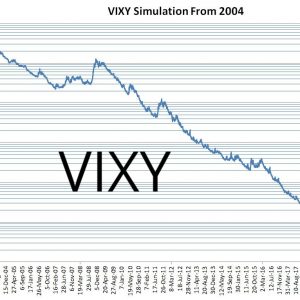
ProShares’ VIXY Backtest
$19.00 Add to cart
-
VXX O/H/L/C Backtest
$59.00 Add to cart -
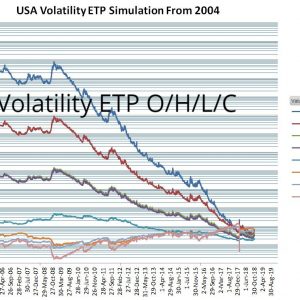
Volatility ETP O/H/L/C Backtests
$199.00 Add to cart -
TVIX O/H/L/C Backtest
$59.00 Add to cart -
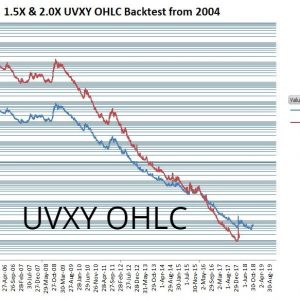
UVXY O/H/L/C Backtests
$59.00 Add to cart -
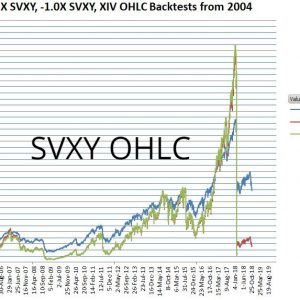
SVXY O/H/L/C Backtests
$59.00 Add to cart -
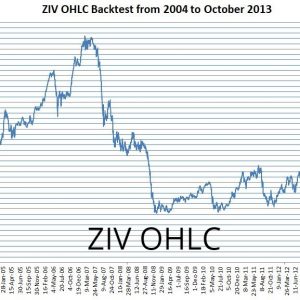
ZIV O/H/L/C Backtest
$59.00 Add to cart -
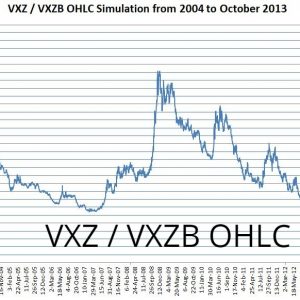
VXZ O/H/L/C Backtest
$59.00 Add to cart -
VIXY O/H/L/C Backtest
$59.00 Add to cart