How Volatility ETPs Really Work TL;DR

The short-term Volatility ETPs hold a mix of the two nearest-to-expiration VIX futures. The ETPs are either long both of those (e.g., VXX, UVXY, UVIX, VIXY) or short both of those (SVIX, SVXY).  If the VIX futures term structure is in contango, with prices increasing with time, then the tendency will be for both futures to drop in value on a daily basis–so a long ETP …

Read more

The Cost of Contango—It’s Not the Daily Roll

It’s well known that long volatility Exchange Traded Products (ETPs) like VXX, UVXY, and UVIX often experience devastating losses during market quiet spells—even when the value of the VIX is staying relatively stable.  These heavy losses occur when the VIX futures that underlie these funds are in a price/time arrangement called contango. The chart below shows an example of VIX futures in a contango configuration.

ts-16sep16

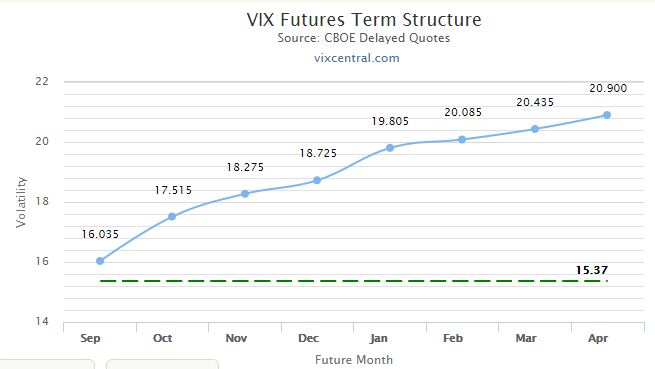
The blue dots show the prices of various futures and the horizontal scale indicates the month of expiration.  The horizontal green line shows the current VIX price— also known as the “spot” price.  You can’t tell it from the chart, but in this example, the leftmost future has 4 days until expiration.  At expiration, a VIX future’s value will be very close to the VIX spot price.

When futures are in contango the longer the future has until expiration the higher its price.

If you were to take a time-lapse video of this chart over time with a stable VIX you would see the blue dots moving down the blue line, eventually intersecting with the green VIX line at expiration.

Read more

The Volatility Term Structure is Driven by OTM Puts

The CBOE’s VIX® methodology calculates a single theoretically grounded number that quantifies virtually the entire volatility landscape for a specific point in time—pretty cool.  Prices for hundreds of different options with different expiration dates can be involved in the calculation.   This single number is very useful, but obviously, lots of information is discarded in the distillation.  I’ve wondered if the VIX’s compression is hiding some information …

Read more

A 3D View of the S&P 500: Price, Time, and Markets

There are lots of valid ways to look at the market.  Obviously, price is important, but a number alone (e.g., 1487.85—the Feb 25, 2013, S&P 500 close) doesn’t mean much.  Price related metrics like percentage changes and support/resistance levels add value, but adding time as a factor enables some really interesting measures like moving averages and momentum trackers.    My favorite time-related metric is term structure—how the …

Read more

10 Questions about Mid-Term Volatility

Why is mid or medium-term volatility defined as being 4 to 7 months out? In January 2009 Barclays introduced VXZ, the first medium-term volatility Exchange Traded Product (ETP).  Its tracking index (SPVXMP) relies on 4 to 7-month VIX futures.  I suspect that range was selected because historically (2004 through 2008) the term structure on the 4th through 7th-month VIX futures was relatively flat but still tracked …

Read more