For my 2015 year end prediction for the S&P 500 see this page.
Update: In the post below I wonder how long the close correlation between the S&P 500 and its prices six years previous will continue. December 31, 2014 provided the answer: 5 years—the correlation failed in 2014 with an ending difference of 25.9%. No half measures here. This sort of pattern matching between historical periods and the present is a favorite pastime of many financial writers, but the bottom line is that most of the time it’s not predictive. For more see “Patterns, Predictions, and the Correlation Fairy.”
Originally posted on 23-Feb- 2013, updated with the December 31st, 2014 closing values.
My forecasting technique has correctly predicted the S&P 500’s year-end close with an average accuracy of 1.6% for the 2007 through 2012.
| Year End | Estimated | Actual | % Difference |
| 31-Dec-08 | 879.82 | 903.25 | +2.66% |
| 31-Dec-09 | 1111.92 | 1115.1 | +0.286% |
| 30-Dec-10 | 1211.92 | 1257.88 | +3.79% |
| 30-Dec-11 | 1248.29 | 1257.60 | +0.75% |
| 31-Dec-12 | 1418.30 | 1426.19 | +0.56% |
| 31-Dec-13 | 1468.38 | 1848.36 | +25.88% (way off!) |
This forecast doesn’t require much computation—it’s the year-end closing value of the S&P 500 six years prior. The chart below shows SPY (effectively 1/10 of the S&P 500) from 2003 to 2007 with SPY from 2009 to the present superposed on the same day of the month.
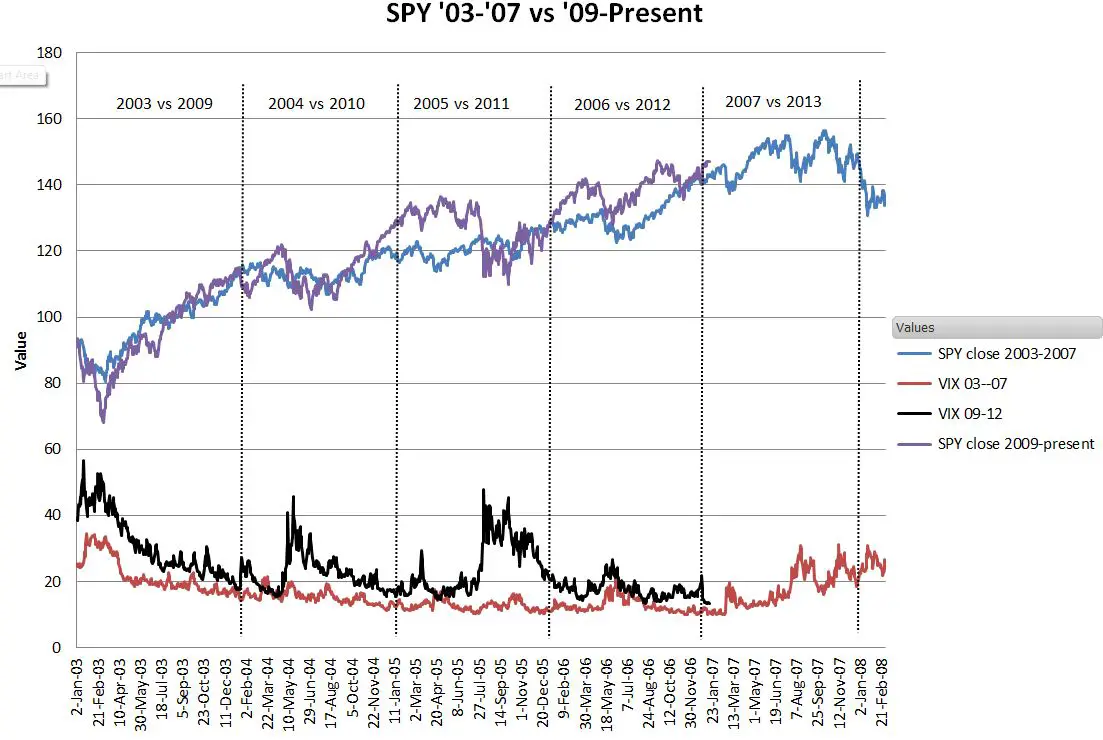 |
At the bottom I’ve shown the VIX index for these two different time spans.
I don’t believe charts from the past are reliable in predicting the future, but since seeing this pattern in November, 2009 I’ve been surprised at its close correlation (0.94!) This year’s divergence was less than 2011’s, with 2012’s SPY going as much as 11% above the 2006 levels and only 3% below.
Correlation does not necessarily imply causation. Nobody believes that today’s market is consulting the 2007 stock records to determine its movements, but on the other hand this pattern does not feel like a random happenstance. I think the similarity comes from both periods being recovery phases after major crashes. The big question is how long will this tracking persist.
If this pattern holds the S&P 500 will end 2013 with a paltry 3% gain—likely with a lot of volatility between now and then. Some of the factors that will be influencing the market this year:
Economy
- In 2007 we were getting into the frothy part of the housing boom/bubble. Qualified buyers were getting scare and prices were sky high. In 2013 housing seems poised for normalcy, with the foreclosure backlog reduced to manageable levels and new starts climbing. New housing is a great creator of jobs and associated demand for materials, appliances, furniture, etc.
- Short term Treasury bills in January 2007 were yielding 4.93%—65 times the January 2013 rate of 0.075%. Even with that level of economic support from the Fed, this economy is struggling to create jobs. The economy will need to improve quite a bit before the Feb starts applying the monetary brakes—and interest rates start their inevitable climb.
- Given 2007’s high interest rates I expected its inflation rate would have been high, but actually inflation was easing in 2007, averaging 2.85%—not much higher than 2012’s 2.07% rate.
- In general unemployment remains high, and wage increases have been very small. It’s possible that structural shifts in the economy have permanently reduced the need for medium to low skill jobs—which would be bad news for demand.
- Europe has been relatively quiet. Clearly the European Union has decided to pay what ever it takes to keep Greece in the union, and this has reduced the overall fear factor. A destabilizing factor is the very high unemployment rates in the weaker countries.
Market valuation and money flows
- The Shiller inflation adjusted PE ratio for the S&P 500 is currently 21.6, which compares to 27.20 in January 2007—20% lower. However, historically this PE ratio has averaged 18.5, so you can argue we’re already near the top.
- There’s a lot of money parked in bonds and cash. If it flows into equities we’ll see a run-up—but it feels like these investors are arriving very late in the recovery. Has the “buy high, sell low” crowd just arrived at the party?
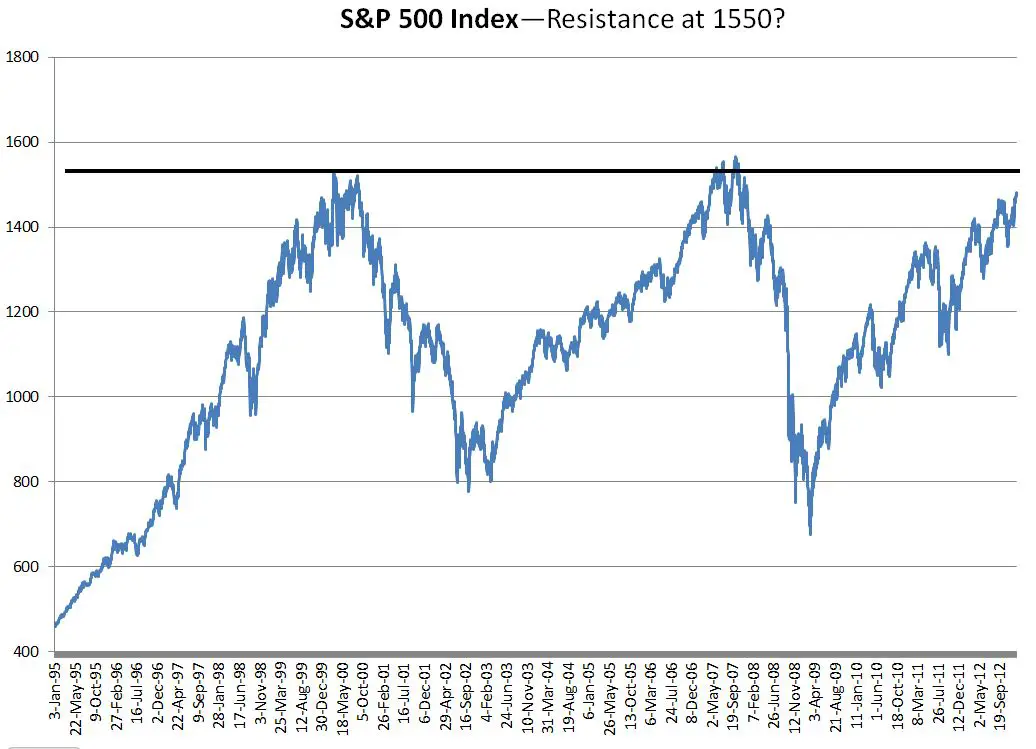
Psychological Barriers
- The 1550 level on the S&P 500 index presents a daunting 13 year old resistance level. No one wants to be the poor sucker that buys at the top.
 |
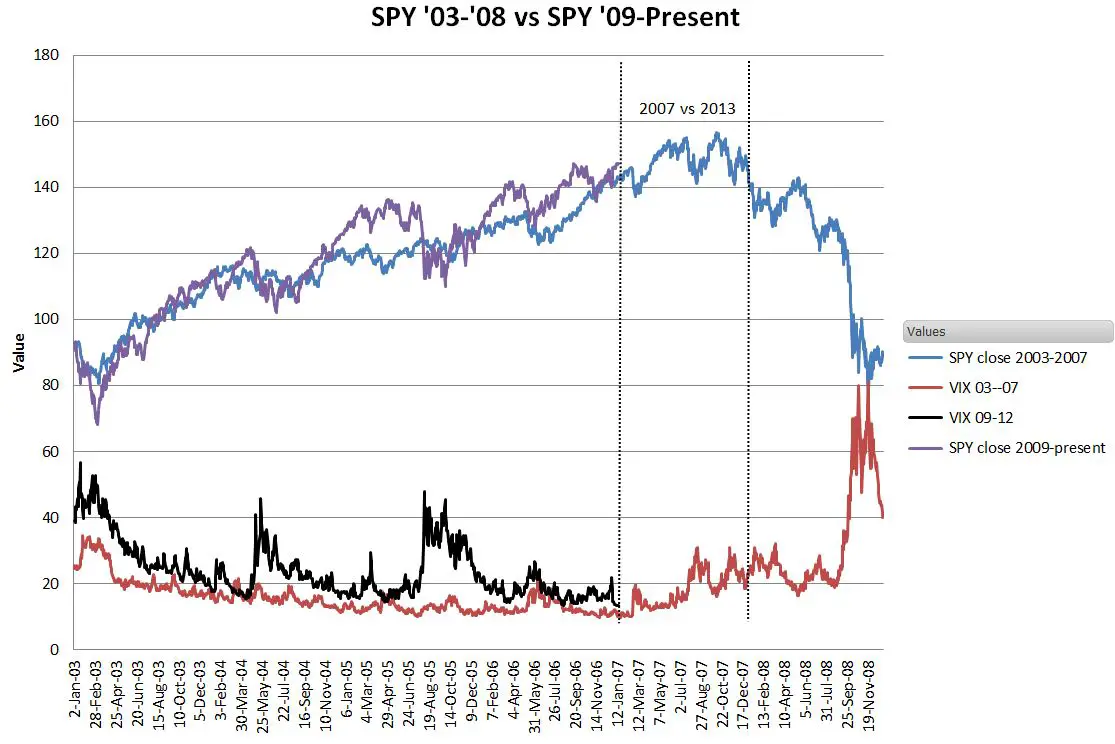
One thing is clear, regardless of how 2013 goes, we don’t want a repeat of 2008 in 2014.
 |
Vance – We are above 1700 now. Do you expect an 15% drop in next 6 Weeks?
Hi Raj,
It’s unlikely, although it has been a long time since a major correction (2011) and people are getting pretty complacent. I think it would take some pretty negative news in the next two months to spark a big correction because November and especially December tend to be quiet, lower volatility months.
— Vance
Hi Vinh, The approach I’m using doesn’t show any predictive power for intra-year corrections, so I can’t give an absolute low number. The volatility has been higher than the market 6 years ago, so I would guess we’ll see a correction in the 8% range.
— Vance
Are you still standing by your year end prediction?
yeah the prediction is not valid anymore considering we are 1745 already. damn this market is on steriods.
Hi Vance, I hope you have been doing good. Do you have a year end prediction for 2014? Your input is always welcome! Thank you.
Hi Vinh, I hope to write a post on this soon. Won’t be using my “6 years ago” model this time around. My prediction for the S&P is 2070, up 12% from the 2013 close.
— Vance