Volatility based Exchange Traded Funds and Notes (ETF / ETN) have only been on the market for a few years (see volatility tickers for the full list of USA based funds). The oldest one, Barclays’ VXX only started trading in late January 2009. Because of their relative youth, we don’t have actual trade data on how they would have performed through critical periods—for example, the 2008/2009 crash. Fortunately, the CBOE provides historical data starting in March 2004 for the VIX futures that underlie VXX, so it’s possible to objectively simulate how it would have performed from that point forward.
Some aspects of the VXX simulation are tricky. For example, some VIX future expiration months did not trade in the 2004 to 2008 time frame so those values need to be interpolated/extrapolated. The prospectus does not spell out whether closing or settlement values of the futures are used for the index calculations (they use settlement values), and the calculation using the daily rolled and rebalanced futures is not straightforward. Even the final step, figuring out the daily fees is not a trivial exercise.
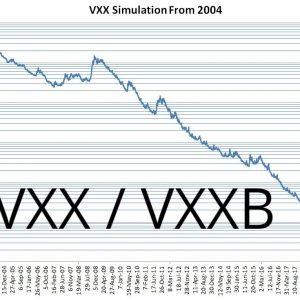
The chart below shows the reverse split-adjusted results (as of Dec 2013).
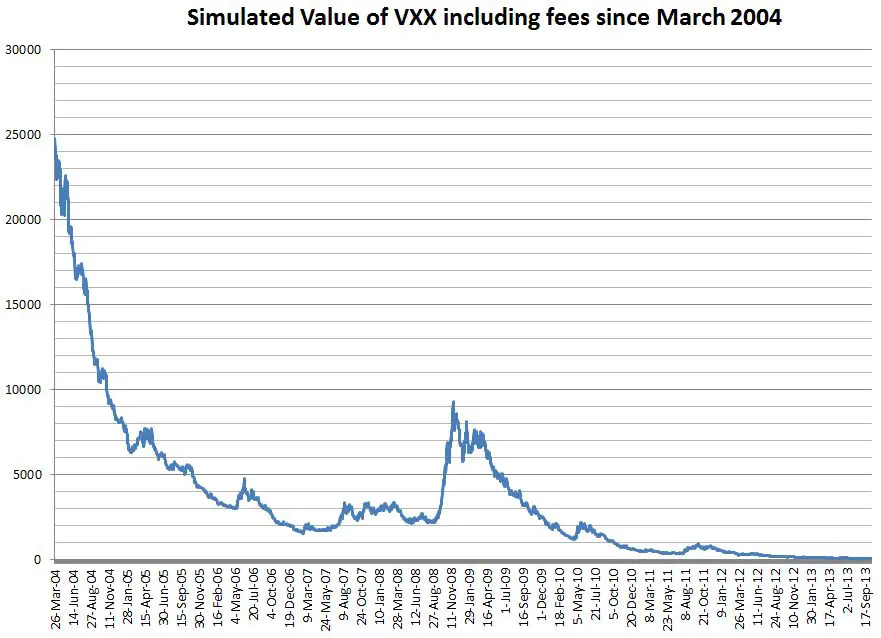
Clearly, VXX would have performed horribly over the 2004 to 2013 time frame with a brief respite in 2008/2009. If you had invested $1000 in VXX in March 2004 you would now have $1.80 left of your initial investment—a 99.8% decline. The long volatility funds have a structural tendency to decline because they hold VIX futures that are historically in contango 70% to 80% of the time, for more on this process see How Does VXX Work? and The Cost of Contango.
If you are interested in purchasing the results of the VXX simulation for the most recent quarter back to March 2004 I have made a spreadsheet available for purchase (see bottom of post) that includes the simulated close values with the annual fee (0.89%). The maximum deviation in my results from the Barclays’ published closing indicative values since the product started trading is less than +-0.04%.
Separately I have done a simulation of VXX open/high/low values over that same period. Those results are inherently less accurate, but still should be useful for testing strategies that are sensitive to intraday values. For more information see this post. That spreadsheet is also available for purchase at the bottom of this post.
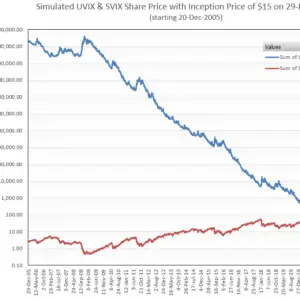
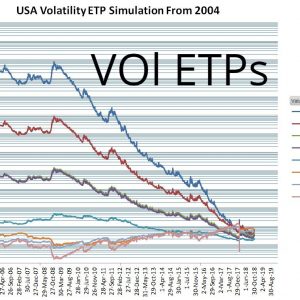
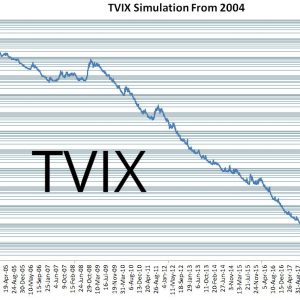
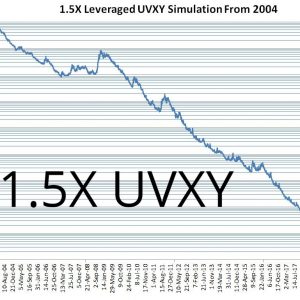
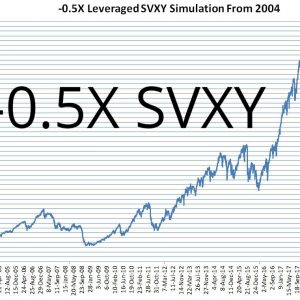
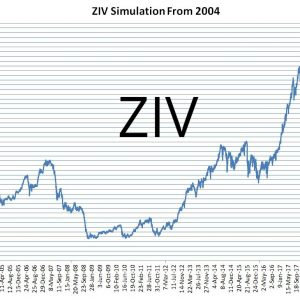
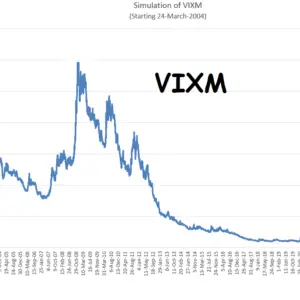
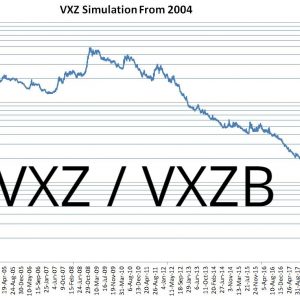
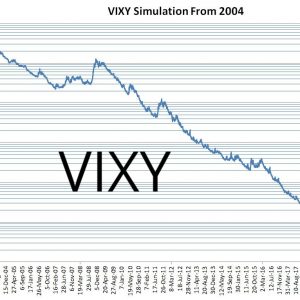
The chart below shows VXX’s performance (in black) relative to a few other volatility-based Exchange Traded Products.
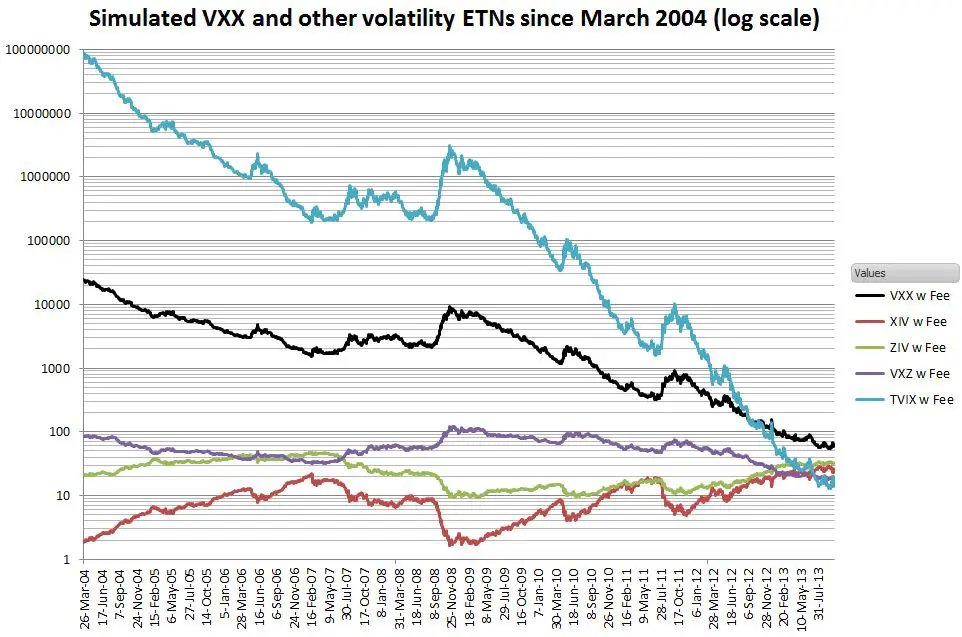
Among the long funds, the 1.5X leveraged short term UVXY from ProShares fares even worse than VXX, declining 99.99999%. Barclays’ medium-term VXZ only declines 78%.
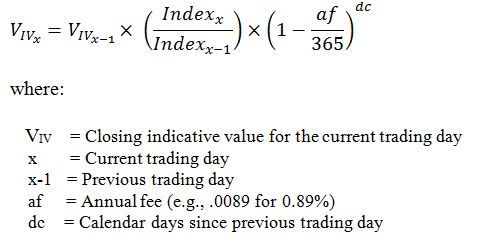
Earlier in this post, I mentioned that computing VXX’s fee was surprisingly difficult. The appropriate equation is not present in any ETP prospectus I have seen—instead, you are treated to prose that would make an IRS agent proud.
Exchange Traded Products typically state their fees on an annual basis (e.g., 0.89%), but in practice, they deduct a fee each day from the assets under management. In computing the fees it’s tempting to start with the daily value of the underlying index (SPVXSTR in the case of VXX) but the actual calculation starts with the final indicative value of the ETP from the previous trading day. It multiplies the previous value by the index gain at close for the current day (one if it is a non-trading day) and then applies the fee. The applicable formula is:
While it’s interesting to simulate how a security would have behaved in the past it’s only one of many possible outcomes. If VXX had existed in 2004, it’s likely the VIX futures that underlie it would have been affected—at least in small ways. Looking forward the uncertainties multiply—there’s no guarantee that VIX futures will behave the same way through upcoming corrections and market crashes.
For more information on the VXX simulation spreadsheet see this readme.
If you purchase the spreadsheet you will be eventually be directed to PayPal where you can pay via your PayPal account or a credit card. Please email me at [email protected] if you have problems, questions, or requests.
-
EVIX / EXIV Backtests
$99.00 Add to cart -
Volatility Shares -1X SVIX, 2X UVIX, and -1X ZVOL ETFs Backtest + Associated Indexes (free)
$0.00 Add to cart -
Volatility Shares BITX (2X Bitcoin Futures) & ETHU (2X Ether) ETF Backtests (free)
$0.00 Add to cart -
VXX Backtest
$29.00 Add to cart -
Volatility ETP Backtests
$99.00 Add to cart -
VelocityShares 2X TVIX Backtest
$29.00 Add to cart -
Proshares 1.5X UVXY Backtest
$29.00 Add to cart -
Proshares -0.5X SVXY Backtest
$29.00 Add to cart -
VelocityShares ZIV Backtest
$0.00 Add to cart -
VIXM Backtest
$29.00 Add to cart -
VXZ Backtest
$29.00 Add to cart -
ProShares’ VIXY Backtest
$19.00 Add to cart
Hi Vance,
How did VIX do in the August 2015 crash? Not well right? It would NOT have been good crash protection per your chart above – correct?
Hi Tom, In August 2015 VXX went up from around 64 to peak at 125. VXX is not a good protection for crashes unless your timing is very good. Not a buy & hold investment. Universa uses out of the money S&P calls it sounds like.
Vance
Hi Vance, I have been cobbling together SPX gap data and VIX changes to simulate VXX during 2008. After all that work I stumbled across your blog! Thanks so much for sharing.
This is odd. I thought I had left a message at the end of this post. I guess I must have written elsewhere. My question is simple. What would be the best way of obtaining historical data for VXV (3-month volatility index)? Thanks for your help!
Hi Johnny,
Send an email to [email protected] and I’ll send you VXV data back to 2002.
Best regards,
Vance
Thank you for the prompt response! I received the data you sent via email.