Years ago I was watching the action around an Atlantic City roulette table when I noticed a man taking careful notes. When I asked what he was doing he said he was looking for long consecutive strings of red or black. If the run got long enough he was going to bet that the ball on the next spin would land on the opposite color because it was “due.”
When I asked him how the ball knew what colors it had previously landed on he frowned and shifted a few steps away.
The Gambler’s Fallacy is an intuitive belief that long streaks, even with fair coins or dice, influence the odds of the next result.
On a day to day basis, the stock market is a lot like the game of roulette, with the probability of an up or down day being very close to 50%. However unlike the roulette ball, the people (and computers) trading on the stock market can remember what has happened previously—so after a long stretch of up days, you would expect a higher probability of a down day. Or so I thought.
For a long time I’ve believed that the market tends to move in 3-day cycles, but inspired by reading Moneyball I decided to see if the data supported my intuition. I took the S&P 500 index data from 1993 to 2013 and analyzed market moves after 3, 4, 5, and 6 up days in a row. Rather than just plotting binary up or down results I plotted the frequency of the percentage results using 0.1% bins.
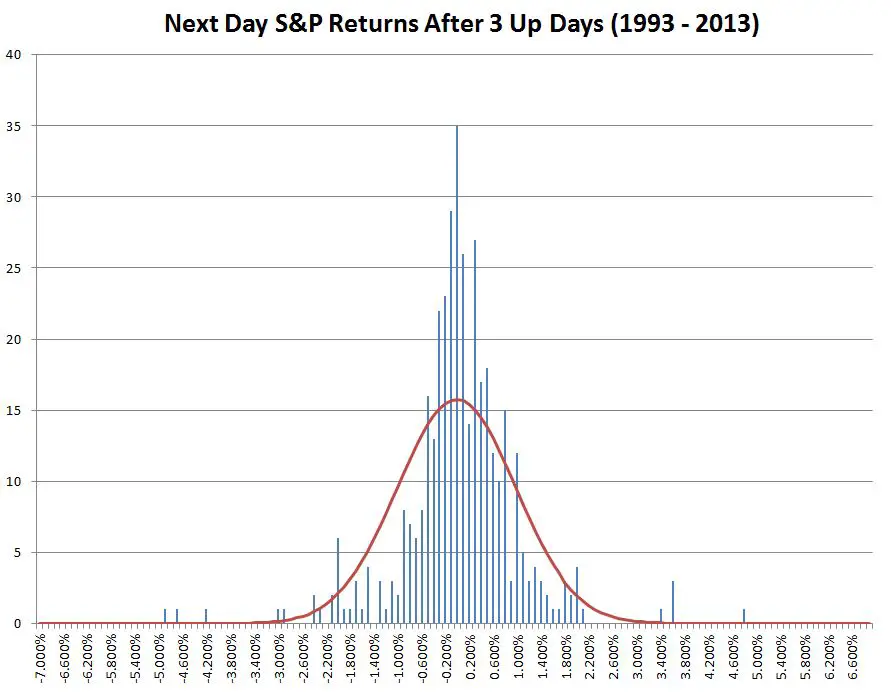
The red line shows the outline of what a perfect normal distribution would look like. The actual data is more clustered around zero, under-represented on the sides of the distribution, with some rather extreme events in the tails of the distribution.
Instead of supporting my intuition the data shows that the stock market is very much like roulette, with no directional bias after three consecutive up days. The average return (mean) is -0.016%— indicating very close to even odds.
I repeated the analysis for bull runs of 4, 5, and 6 consecutive days.
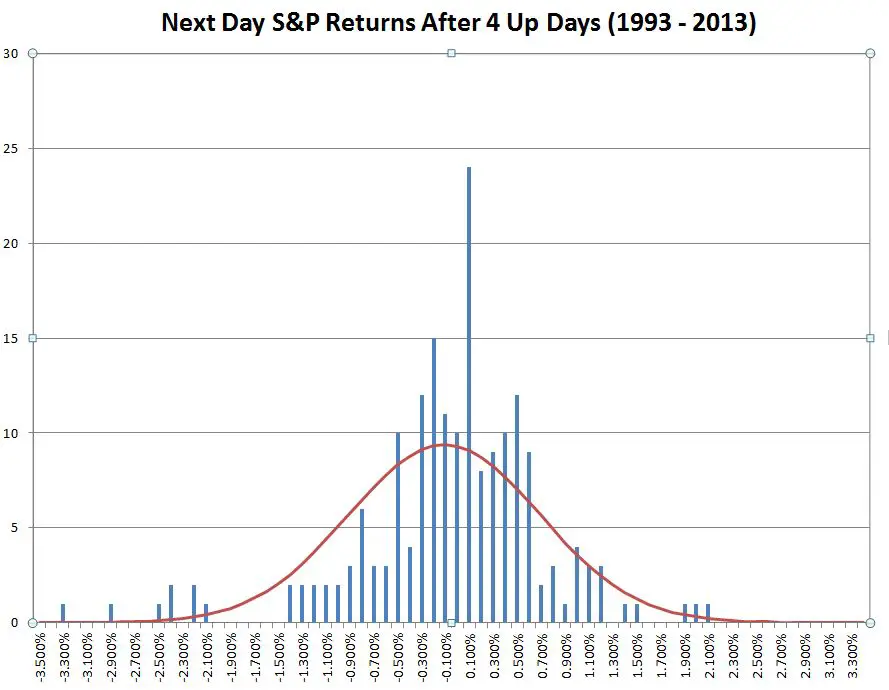
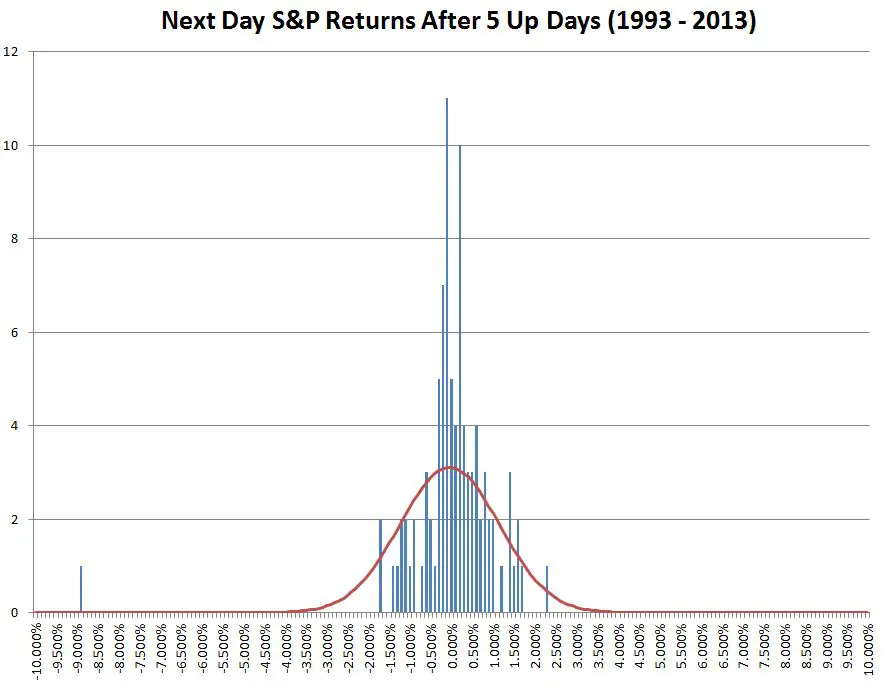
These sequences also show average returns close to zero. With even odds, the number of consecutive days with gains should decrease by 50% for each additional day—for example, 6-day bull runs should happen half as often as 5 day runs. And that is how the market behaves. The chart below summarizes the statistical results.
The 5 Up Days statistics are distorted by a giant 8.9% drop on December 1st, 2008 so I include the 5 up data with and without that drop.
| 3 Up Days | 4 Up Days | 5 Up Days | 5 Up Days (minus 1-Dec-08) | 6 Up Days | |
| Occurrences | 390 | 188 | 93 | 92 | 46 |
| Average Next Day Returns (Mean) | -0.0156% | -0.109% | 0.0444% | 0.0522% | -0.0360% |
| Next Day Standard Deviation | 0.99% | 0.88% | 1.19% | 0.75% | 0.58% |
| Largest Loss | -4.9% | -3.3% | -8.9% | -1.8% | -1.6% |
| Largest Gain | 4.7% | 2.1% | 2.2% | 2.2% | -2.1% |
If you exclude the “7 sigma” event in 2008 there is a trend towards less actual volatility the next day with longer bull streaks. It might be the case that the people involved with the market become increasingly aware of the bull run and start behaving cautiously. This trend would be no help for directional plays, and it’s hard for me to imagine a volatility play that could take advantage of a one-day lull.
Clearly, my notion that the market moves in 3-day cycles was bogus, and the data suggests that any sort of directional analysis based on market history is just another example of the Gambler’s Fallacy.
Nice information I got here without wasting my time and it looks really great. Thanks for your post.
Hi,
But this is not the question. The question is “What is the typical up day count in the SP500?” We are not interested in the next day down move %. We’re interested in when does the down day typically occur? Not it’s average size. By the progression you are showing, and keep adding more up days, it is less and less probable, that there will be a down day or it’s down move average would be small. That is silliness!
what would be interesting is on 4 or 5 up days in a row in the SP. Once it has a down day does it have a 2nd down day in a row. IE U,U,U,U,D,D etc… That 2nd loss in a row would be helpful in how often that happens. (But only after streaks of 4+ IMO
Good work but super computers do this on second by second theme now and thats why average trade hold are in millisecond now.
Over long periods of time the stock market moves around an average, depending on whether the market is above or below the average, the probability of the market moving toward that average is higher than the probability of it moving away. Dividing this into up/down days does not account for the magnitude of the amplitude. A better approach would be to see what the probability of up/down movement is after a certain up/down movement. E.g. What is the likelihood of the market rising an additional 1% after a 1% increase vs. a 1% decrease and vice versa. And then what is the likelihood of a third, fourth, and fifth percent increase without a correction. The result will inevitably be that the likelihood of a correction increases the longer the market moves in the same direction. So the question would be what the average return is on a day after a 1%, 2%, 3%, etc. uninterrupted (i.e. a sequence of up/down days without any down/up days inbetween) drop / rise in the market.
Interesting thoughts here… Believe it would be good to include a report on each of those stocks and their Prices relative to date of study versus Prices say 3/6/12 Months later. In other words.. are the consecutive run a good indicator of success or the opposite
The market is not random. These days there are so many momentum traders and there is an amount of self fulfilling prophecy going on. There are times when obviously sentiment is more bullish or bearish than other times and clearly the length of streaks towards one direction versus another will be affected under these conditions.
The roulette example is pure gamblers fallacy and even worse in a casino you aren’t even getting a 50% chance (0,00). The market is a much more complex beast. People don’t invest over the averages of the last 100 years, but must deal with context of geopolitical, economic, and other issues which create unique states of mind of investors.
I do agree that one should discard using the gamblers fallacy, but if they come up with valid reasons for an ending of a streak (e.g. overbought) or continuing of a streak (e.g. momentum) then it may really be reflective of altered short term probabilities. Also, there are many signals in the market that may have some use in helping to predict occasionally.
Lately, I’ve had some success trading in a contrarian way. When an individual stock has gone up starkly beyond a reasonable valuation mostly on momentum and help from index and etf buying. I bet short against it expecting a short term correction back to a more reasonable valuation after getting mispriced. That could get mistaken for a gamblers fallacy, but when individual stocks move(or for that matter the macro market), it isn’t supposed to be random but reflective of a return on investment. If that return on investment gets out of whack, eventually it will be corrected, sometimes sooner than later.
Hi Saw123. I was very surprised when my analysis showed that the market was acting randomly. Obviously there are human physiological effects going on, but when viewed through the lens of statistics it does appear random. Your contrarian strategy does not sound like gamblers fallacy to me, you are betting on mean reversion + plus some economic analysis, which does come into play over longer time frames.
Vance
It is not random for every time frame. In bull markets there is a notable bias for positive streaks and in bear markets a notable bias for negative streaks. Example, since Trump election NASDAQ has had roughly 3 or 4 up days for every down day. Obviously, positive streaks are more likely than negative and if you were to measure any number of consecutive up days, it would be more likely to have another up day than a down day in that environment.
I do agree with you, that it has little to do with a “streak”, just really the background of what the current sentiment is (bull or bear). So, there is an overlay of randomness on top of a non-random trend..
Tom DeMark’s indicators enjoy a remarkable endorsement in the financial industry. Researchers at ETH Zurich recently investigated the predictive power of three DeMark indicators over 21 commodity futures markets and 10 years of data. For the period from Jan. 2004 to Jan. 2014, the tests suggest statistically significant predictive power on a wide range of commodity futures.
Vance, has a similar analysis been performed on individual stocks? It seems straightforward and logical that a market index has no memory but I imagine the gambler’s fallacy has a more significant effect on individual stocks.
This is quite old, but I wanted to make a comment. Something isn’t right here. If there is no bias and it is just as likely to go up as it is to go down, and by the same amount, then the market shouldn’t move anywhere, but it does.
Hi Kir, Good question. It turns out there is a bias, but it’s small (+0.16%) at a daily level. This bias is the long term average return of the S&P 500. For sequences of small numbers of days as I discussed in this post it’s insignificant.
It does strongly support the random walk theory of the markets. Although fresh news will modify the distribution at any given point in time.
It’s also possible that the impact of past values results in a longer term shift in probabilities, rather than an immediately obvious shift in the next day outcome. I feel that there are methodologies for testing for such time series patterns, but I can’t recall them off the top of my head.
Great article Vance. However, why you combine a binary event (3 up days) with a discreet measurement of the performance? Wouldn’t it be more useful for trading purposes to compare, say 5-10% market returns, (maybe happening in a limited number of days) with successive performance?
The distribution curves you created are strongly leptokurtic, guess I would be very happy to see them in a casino, perhaps this could be a tiny trading advantage?
Hi Lore, I used the binary events because that was the pattern I had personally followed. It would be straightforward to modify the analysis to trigger off percentage gains as you suggest, but I strongly suspect the results would be the same–randomness rules.
The leptokurtic distributions are interesting, but the fairly common high sigma events could blow up a lot of schemes that tried to profit from the typical behaviors.
— Vance