The Cboe’s VIX®, VIX3Msm (93-day), and VIX6Msm (184-day) indexes enable us to quantify volatility term structures but until now, historical analyses between VIX style indexes have been limited to dates after December 2001 in the case of VIX3M and January 2008 for VIX6M. This post introduces the results of VIX6M style calculations back to 1990 and reviews issues and trends that were revealed.
In November 2013, the Cboe introduced VIX6M, a volatility index that uses the same basic methodology as the VIX but using a 6-month time horizon (specifically 184-day) instead of the VIX’s 30 days. Initially introduced as the VXMT index and renamed to VIX6M in 2018 we gained another very useful data point on the volatility term structure of SPX (S&P 500) options. Term structures reflect how commodity/security prices change over a time horizon. For example, the price of a corn future that delivers at harvest time will likely be lower than prices for delivery at other times of the year. That low point reflects the willingness of sellers at harvest time to accept a discounted price rather than put corn into storage. For more information on term structures see this post.
The Cboe has published values for VIX6M starting January 7th, 2008 (their VIX data starts in 1990). Using the Cboe’s VIX6M methodology, I have calculated 184-day volatility numbers, using historic SPX options data and treasury yields back to 1990. The rest of this post describes the specifics of the calculation and analysis of the results. These results are not official VIX6M values. Here, and at the end of the post, there is a link to purchase a spreadsheet that incorporates my results from 1990 through 2019.
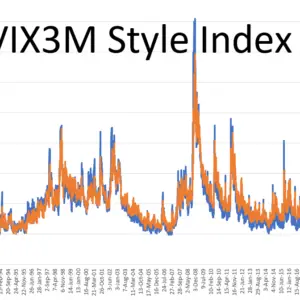
When doing these VIX style historical calculations I first generated VIX3M values and reused the option data, treasury bill data, and algorithms to calculate the VIX6M values back to January 1990 My VIX3M post provides more overview and some additional analysis, so if want the full picture, you should read that also.
How is the VIX6M calculated?
- Select options series with expirations that straddle the desired184 day horizon.
- Compute the implied variance for each of these series using selected put and call prices and appropriate interest rates.
- Do a variance interpolation to calculate 184-day variance and then convert to volatility.
For more information see the Cboe’s VIX White Paper, the CBOE’s VIX6M Methodology, and my post Calculating the VIX, the Easy Part.
Differences between the Cboe’s VIX6M Calculation and Mine (VIX6M-SFI)
- The closest option series to the target time horizon were not always the ones used. If the closest series didn’t have at least 20 combined puts and calls I observed that the calculation resulted in an overly high value within the historical context. In those cases using the next available monthly series further away from the target time horizon returned a much more reasonable result.
- USA treasury interest rates were linearly interpolated rather than doing the cubic-spline approximation the Cboe. The results are not materially impacted by using this simpler approach.
Comparing Results With The Cboe’s
To validate my calculations, I compared my results from the 7-Jan-2008 to the 26-Feb-2010 period with the historical values that the Cboe publishes. The results are shown in the next chart:
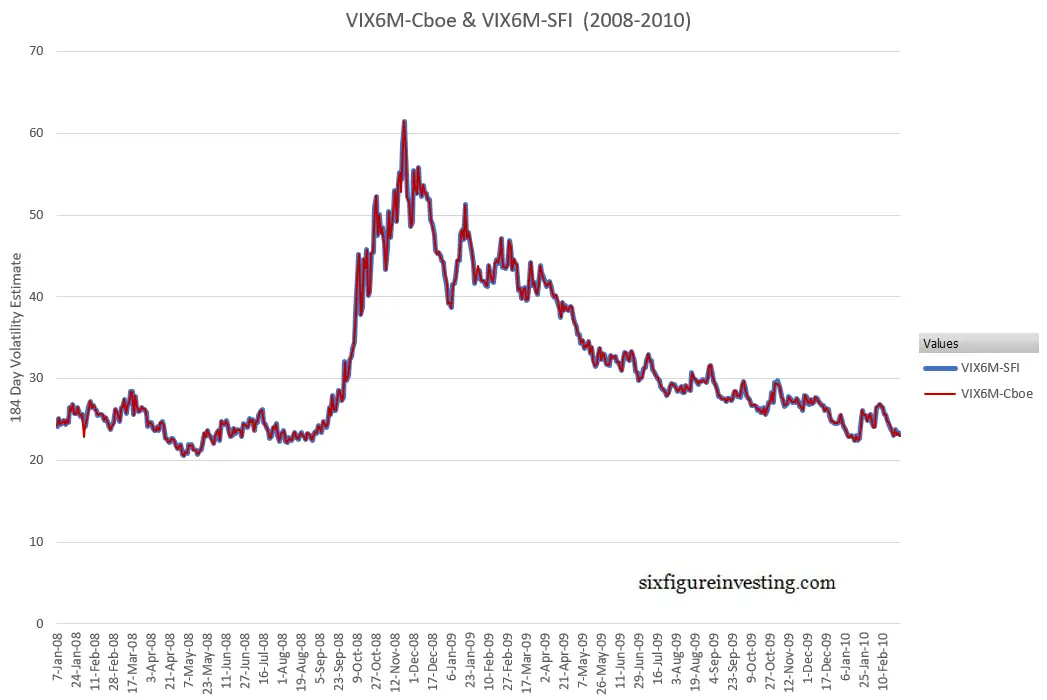
Very close but not identical.
The average daily difference is 0.005% and the standard deviation of differences was 0.22%. The next histogram shows the distribution of percentage differences between the two sets of VIX6M style calculations:
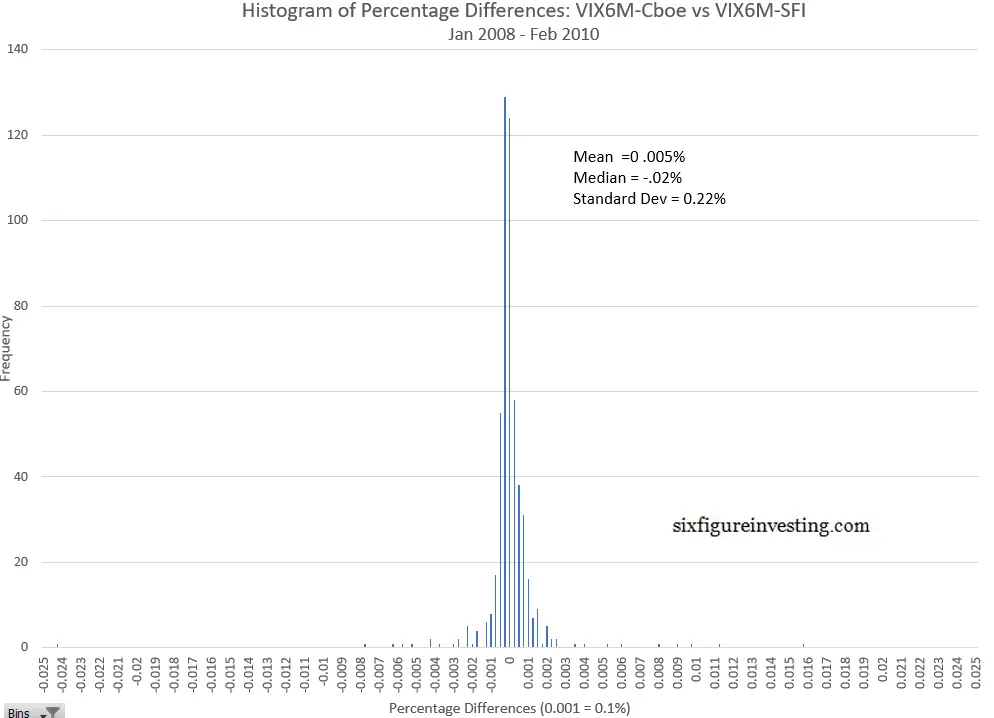
I believe the differences, with one exception, are due to a timing difference between the SPX option data I used and the Cboe’s dataset. The Cboe establishes the VIX6M’s end-of-day value at 4:15 p.m. ET and uses SPX option prices at that point for their calculations. My SPX option data is a 4 p.m. ET NYSE close snapshot. Any differences in the SPX option prices used in the VIX6M calculation between 4 p.m. and 4:15 p.m will cause the index calculations to differ. As you would expect, these differences are larger in the VIX3M results because shorter-term options are typically more volatile.
One difference in my VIX6M calculations vs the Cboe, a big one, is on January 31, 2008. The Cboe’s published value is 11.1% lower than the previous day’s value — a 16 sigma outlier. The Cboe’s VIX and VIX3M values for that day only had -5.14% and -3.34% moves respectively, nothing that would suggest a big negative move in the VIX6M, which tends to move less than the shorter horizon indexes. My VIX6M calculation for that day was down only 2.5% from the previous day. Normally when both the Cboe’s data and my data are available for a day I default to Cboe’s results but for this date, I’m assuming the Cboe’s value resulted from a calculation/data error and I used my calculated value.
Problematic Days January 1990 through January 2008
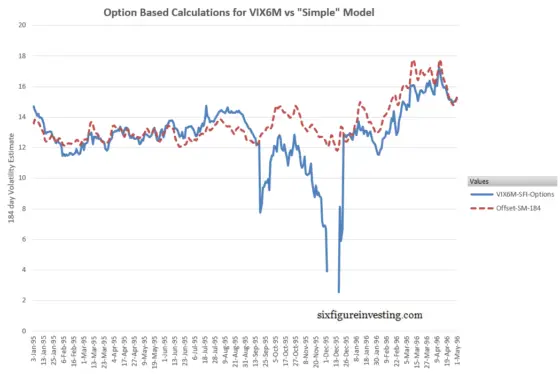
Before January 2009 there is no publically available Cboe data so I needed to use other methods to verify my results. The biggest problem I found was a 3-month stretch during a sustained bull market (19-Sept-1995 to 20-Dec-1995) when the SPX index was trading at or above the highest strike price available on the listed options. Evidently, the Cboe did not issue additional strikes on the existing option series during that period, resulting in calculated VIX6M values that are either suspiciously high or not valid. VIX style calculations become unreliable or break (e.g., attempted square root of a negative number) if you don’t have options strikes that straddle the SPX index’s current value.
Rather than leave that period blank, I employed my “simple” model for VIX future’s prices to extrapolate a 184-day volatility value using the historic VIX values for that period. As the chart below illustrates, the simple model approach (red line) generates VIX6M style values for that Fall 1995 period that are much more reasonable than the suspect SPX option derived values.
Another period. 29-Apr-2002 through 7-Jun-2002 also had some calculation failures and some suspect values. In this period there was a lack of option data between the 850 and the 1100 strikes — when the SPX was trading around 1100. I used the alternative simple model projections during that period also.
Characteristics of the VIX6M from 1990 through 2019
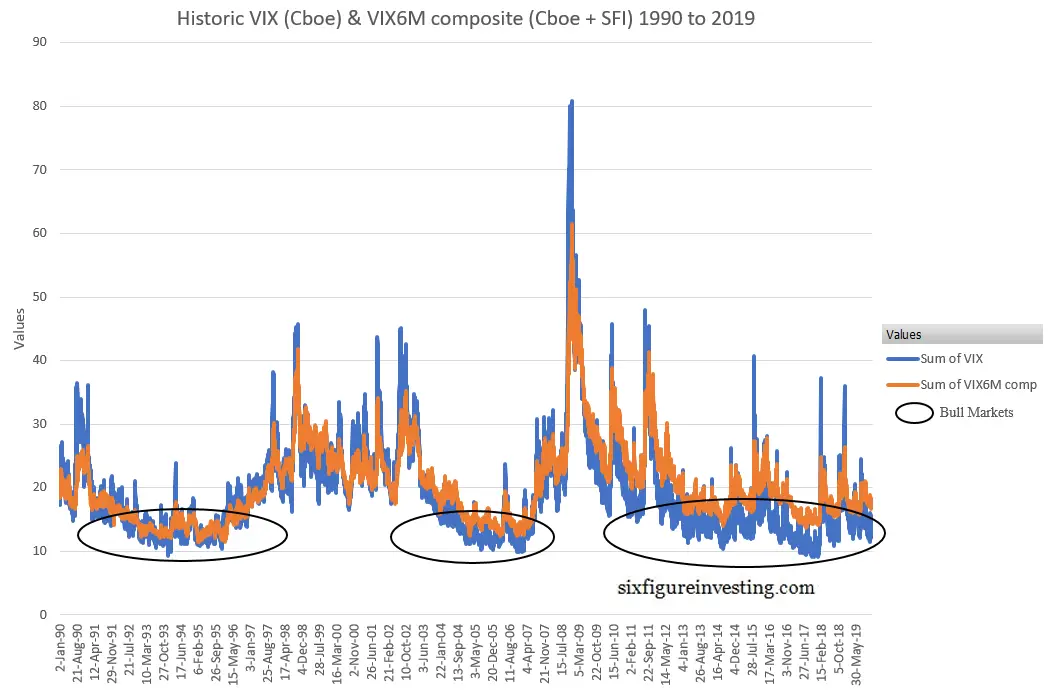
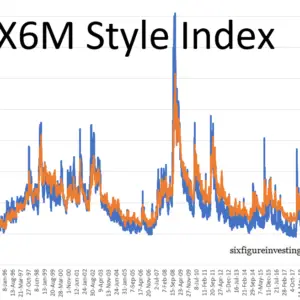
The combined results of my VIX6M-SFI calculations together with the Cboe’s creates a 30-year series that matches the time span of the historic VIX dataset. Looking at the chart below you can see that the VIX has consistently spiked higher than the VIX6M during panicky periods, and while the VIX frequently drops below the value of VIX6M during quiet times, it appears that the extent of this behavior has shifted over time. As indicated below, the amount of blue (VIX) below the VIX6M concentrations during bull markets has increased over the last 3 decades.
Experimenting with various ways of quantifying this behavior I found that plotting the minimum and maximum values of a rolling 30 trading day sample of VIX/VIX6M values worked well. The resultant chart looks like this:
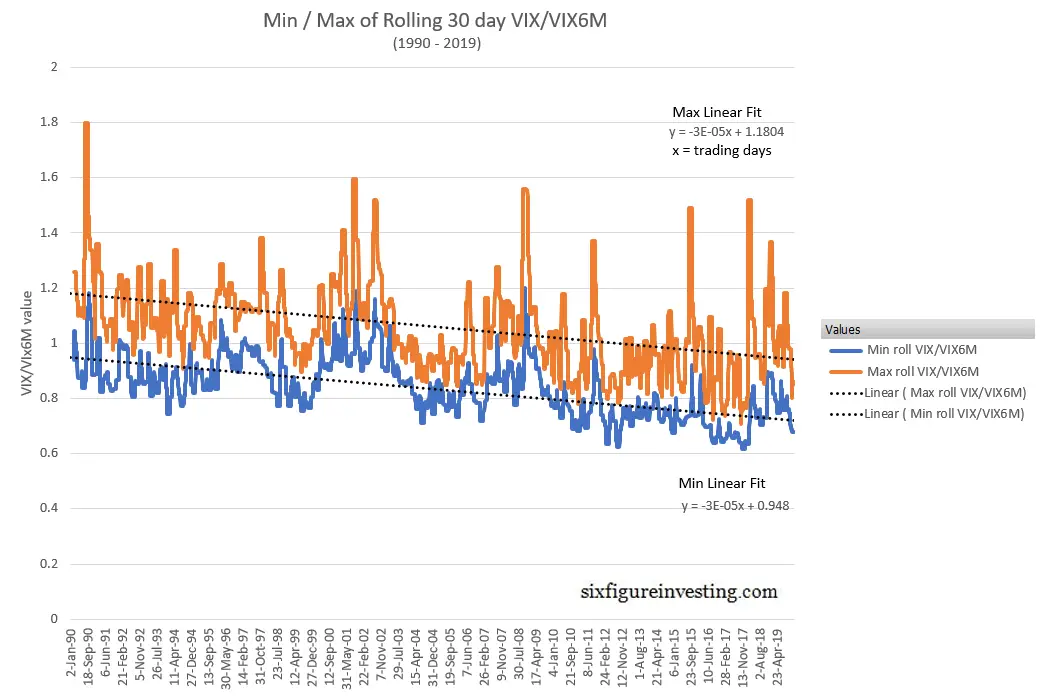
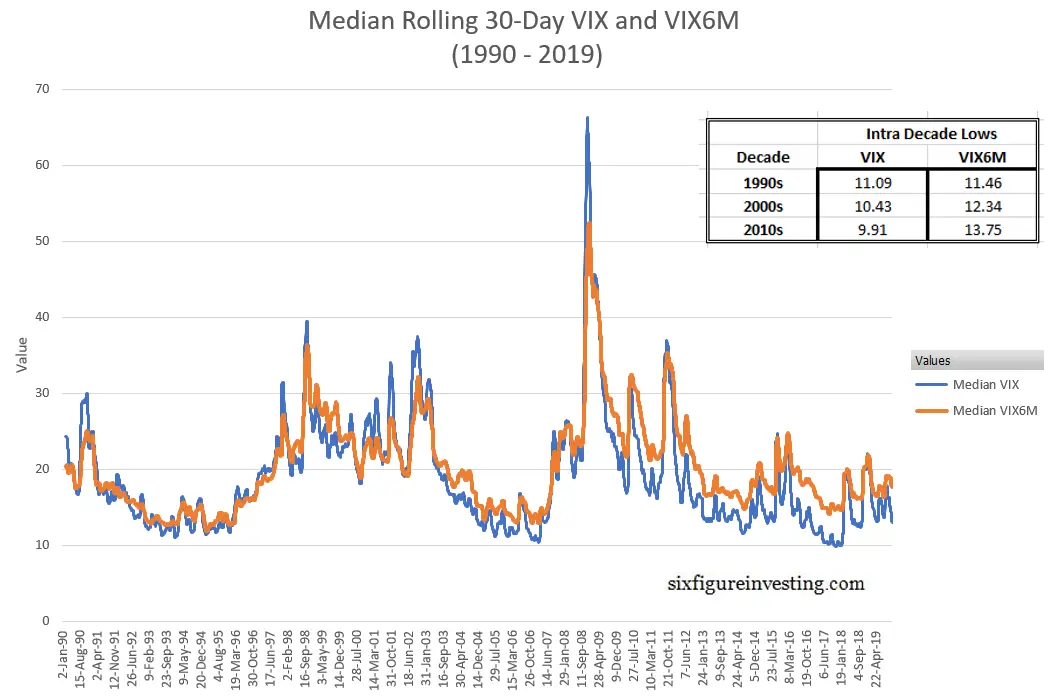
This trend in the VIX/VIX6M ratio is due to changes in both the VIX and VIX6M behavior’s, illustrated in the next chart, with the VIX’s intra-decade lows dropping around 7.5% per decade and the VIX6M’s intra-decade lows increasing by 7.7% between the 1990s and the 2000s, and 11% between the 2000s and the 2010s.
Whether this trend will continue is anybody’s guess but these charts make it clear that VIX term structure is not static within the context of repeating bull/bear markets—there’s been a 30-year steepening trend in the term structure. Other than the simplistic observation that SPX options with about 6 months until expiration have become relatively more expensive than SPX options with about a month to go, it’s tough to say what’s causing this trend. It could be that volatility sellers are moving shorter term to harvest more premium or alternately, institutions are shifting their purchases of protective puts to longer time frames.
Conclusion
Access to historic data is a multi-dimensional risk/opportunity. It can challenge or confirm our assumptions, enable us to quantify trends/behaviors that we intuited but couldn’t formalize, or lure us into overfitting. User beware.
Hi Vance,
I know it would not add a lot of additional detail, but I am wondering if you’ve thought about updating these charts and analysis with the most recent couple years of data? The pandemic, in particular, was a pretty significant event, and I’m wondering if there’s any evidence of term structure changing at all. Would love to see!
Thanks for your consideration.
Hi Lee, That’s a good idea. Shouldn’t take much work to update the graphs.
Vance
Any thoughts on the recent Dec Future Vix Dip?
http://vixcentral.com/
Hi Barry,
The December dip almost always shows up on the VIX Futures’ term structure. Last year was different because of the election, but before that I believe there has always been a December dip, reflecting the typically lower volatility during the end of year holidays, etc.
Vance
Very Nice
I’m curious: Would you be able to make a spreadsheet of the VIX9day going back to 1990?
Hi FGH,
I could but I don’t think it would be very accurate. The SPX weeklies didn’t start until 2010 so before that there would be times when the closest to expiration options would have 30 days to go. That would require a lot of extrapolation on the part of the term structure that tends to be the most variable.