I am offering a Volatility ETP Projection Service that calculates future volatility Exchange Traded Product (ETP) prices assuming the current VIX futures term structure is stable.
In my post Using the VIX Futures Term Structure to Predict Volatility ETP Prices, I show how this approach can be used to produce statistically valid ETP price projections and ranges.
This forecast does not attempt to predict upcoming volatility spikes or slumps—it’s totally focused on the price trends that would occur with a static VIX futures term structure.
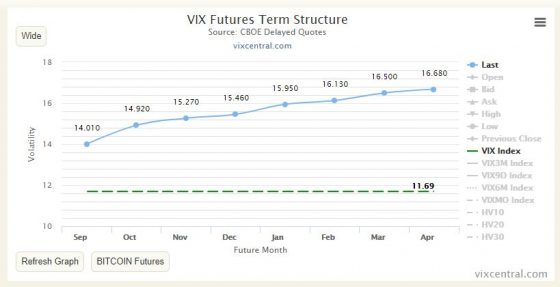
With a stable term structure (and a stable spot VIX), the VIX futures prices that underlie the volatility ETPs like VXX, VXXB, UVXY, and SVXY do change but they precisely follow the price/days-til-expiration curve. The VIX Central chart below shows the closing VIX futures prices for August 23, 2018. If the term structure is stable then the curve at the end of the 24th would have the identical price vs time shape but the blue data points, representing futures values, would all be shifted slightly down and to the left.
The VIX futures that underlie the volatility ETP are volatile creatures—tomorrow’s values can be dramatically different than today. I’m not trying to predict those sorts of changes. What I am computing is the decay or boost that the volatility ETPs experience if the term structure stays in a stable contango or backwardation configuration. This calculation is not an easy problem—there are a lot of moving parts even when the market is stable.
Historically the VIX futures term structure has been in a contango configuration 80%+ of the time. Contango fuels a situation where the long volatility ETPs like VXX, UVXY, or TVIX suffer from high decay factors. Anyone that’s looked at their long-term charts will see the massive impact of those decays over the long run.
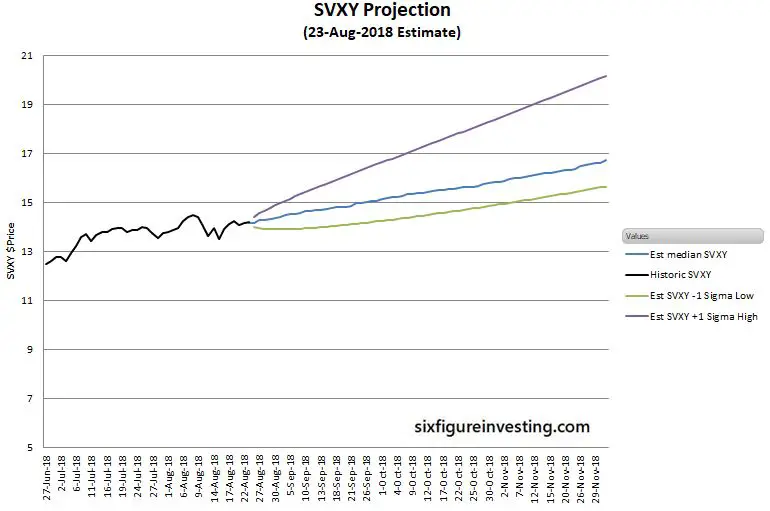
Because of the typical decay in long volatility products, short volatility trades are popular but the possibility of volatility spikes makes risk management an important concern. By estimating median prices and +-1 sigma ranges traders have some analytical results that can help quantify payoffs and establish appropriate risk management thresholds.
The chart below shows a typical SVXY projection when the term structure has been in contango for a while.