First posted September 11, 2013
INTRODUCTION
Always interested in alternatives to buy and hold, Vance has generously allowed me to describe my stock market trading method here, and to post its buy and sell signals as they occur in the future. This information is for educational and entertainment purposes only, it will never be a recommendation to buy or sell anything. But I believe that it will prove interesting to consider and watch over time.
Additional Information on Frank’s Method
- Short Sweet Spot Approaching (January 2016)
- Breadth Divergence (April 2016)
- Breadth Divergence (November 2016)
CURRENT STATUS
- Frank switched from the Russell 2000-based underlying to the $SPHB ETF in 2025, a post from Frank describing that transition is located here: A Method to Exploit High Beta.
- The most recent, and last published move in Frank’s Russell 2K based method was 2-Aug-2024: Moved from 100% long to 50% long
HISTORICAL MOVES
| Date | New Position | Russell 2000 Value | Hypo- thetical Portfolio Value | Portfolio Percentage Change (not including dividends reinvested) |
| 17-July-09 | 50% long | 522.02 | 522.02 | |
| 30-Nov-12 | 100% long | 821.92 | 674.19 | 29.1% |
| 11-Apr-14 | 50% long | 1111.44 | 918.32 | 35.2% |
| 6-Jun-14 | 100% long | 1165.21 | 940.37 | 2.4% |
| 18-July-14 | 50% short | 1151.61 | 907.59 | -1.2% |
| 29-Aug-14 | 100% long | 1174.35 | 898.42 | -1.0% |
| 26-Sept-14 | 50% short | 1119.33 | 845.89 | -4.7% |
| 24-Oct-14 | 100% long | 1118.82 | 846.09 | 0.0% |
| 7-Aug-15 | 50% short | 1206.90 | 922.85 | +7.87% |
| 30-Sept-15 | 50% long | 1100.69 | 966.18 | +4.21% |
| 9-Oct-15 | 100% long | 1165.36 | 994.47 | +2.9% |
| 11-Dec-15 | 50% short | 1123.61 | 991.37 | -3.58% |
| 26-Feb-16 | 100% Long | 1037.18 | 1028.25 | +3.84% |
| 4-Nov-16 | 50% Long | 1163.44 | 1150.18 | +12.17% |
| 11-Nov-16 | 100% Long | 1282.39 | 1209.13 | +5.1% |
| 9-Feb-18 | 50% Long | 1477.84 | 1386.81 | +15.24 |
| 16-Feb-18 | 100% Long | 1543.55 | 1417.78 | +2.22 |
| 23-Mar-18 | 50% short | 1510.08 | 1433.60 | -2.17% |
| 11-May-18 | 100% Long | 1606.79 | 1389.18 | -3.37% |
| 5-Oct-18 | 50% Long | 1632.11 | 1417.47 | +1.58% |
| 9-Nov-18 | 100% Long | 1549.49 | 1381.76 | -2.53% |
| 7-Dec-18 | 50% Long | 1448.09 | 1304.40 | -6.54% |
| 4-Jan-19 | 100% Long | 1380.75 | 1274.38 | -2.33% |
| 22-Mar-19 | 50% Long | 1505.92 | 1433.60 | +9.12% |
| 5-Apr-19 | 100% Long | 1582.56 | 1451.34 | +2.54% |
| 17-May-19 | 50% Long | 1535.76 | 1418.27 | -3.96% |
| 7-Jun-19 | 100% Long | 1514.39 | 1408.47 | -0.7% |
| 16-Aug-19 | 50% Long | 1493.64 | 1374.30 | -1.37% |
| 13-Sept-19 | 100% Long | 1578.14 | 1413.59 | +2.83% |
| 4-Oct-19 | 50% Long | 1500.70 | 1337.80 | -4.91% |
| 1-Nov-19 | 100% Long | 1589.32 | 1377.50 | +2.95% |
| 31-Jan-20 | 50% Long | 1614.06 | 1413.73 | +2.63% |
| 27-Mar-20 | 100% Long | 1131.99 | 1204.83 | -14.78% |
| 03-Apr-20 | 50% Long | 1052.05 | 1137.71 | -5.57% |
| 09-Apr-20 | 100% Long | 1246.73 | 1241.31 | +9.11% |
| 12-Jun-20 | 50% Long | 1387.68 | 1365.99 | +10.04% |
| 17-Jul-20 | 100% Long | 1473.32 | 1408.62 | +3.12% |
| 11-Sep-20 | 50% Long | 1497.27 | 1436.53 | +1.98% |
| 09-Oct-20 | 100% Long | 1637.55 | 1503.59 | +4.67% |
| 30-Oct-20 | 50% Long | 1535.17 | 1423.23 | -5.35% |
| 6-Nov-20 | 100% Long | 1644.16 | 1473.63 | +3.54% |
| 18-Jun-21 | 50% Long | 1503.59 | 2022.88 | +37.27% |
| 27-Aug-21 | 100% Long | 2277.15 | 2040.50 | +0.87% |
| 26-Nov-21 | 50% Long | 2245.94 | 2050.85 | +0.51% |
| 18-Mar-22 | 100% Long | 2086.14 | 1979.25 | -3.49% |
| 08-Apr-22 | 50% Short | 1994.56 | 1914.05 | -3.29% |
| 27-May-22 | 100% Long | 1887.9 | 1964.65 | +2.64% |
| 10-Jun-22 | 50% Short | 1800.28 | 1952.42 | -0.62% |
| 24-Jun-22 | 100% Long | 1765.74 | 1970.39 | +0.92% |
| 26-Aug-22 | 50% Short | 1899.83 | 2228.51 | +13.2% |
| 21-Oct-22 | 100% Long | 1742.24 | 2316.43 | +3.95% |
| 09-Dec-22 | 50% Short | 1796.66 | 2431.93 | +4.99% |
| 13-Jan-23 | 100% Long | 1887.03 | 2371.85 | -2.47% |
| 24-Feb-23 | 50% Short | 1890.49 | 2409.38 | +1.58 |
| 2-Jun-23 | 100% Long | 1830.91 | 2448.8 | +1.55% |
| 18-Aug-23 | 50% Long | 1859.42 | 2478.67 | +1.3% |
| 3-Nov-23 | 100% Long | 1760.70 | 2412.71 | -2.66% |
| 19-Apr-24 | 50% Long | 1947.66 | 2668.90 | +10.6% |
| 10-May-24 | 100% Long | 2059.78 | 2742.50 | +2.9% |
| 2-Aug-24 | 50% Long | 2109.31 | 2859.61 | +4.2% |
METHOD DESCRIPTION
My method is similar to the 4 percent method on the Value Line Geometric Index, as first published by Ned Davis in the early 1980s. For those unfamiliar with this index, it is described here.
Davis’s algorithm simply bought long any 4% or greater move up in the weekly closes of this index and sold and went short on any 4% or greater move down in the weekly closes. His algorithm captured a good portion of every major move up or down, but, typical of a trend-following method, suffered a number of whipsaw losses, primarily due to false sell signals. I tried a number of ways to reduce these and found two that worked well.
The first uses a trend line. By dynamically constructing this line and deferring action until the market penetrated it, the method reduced whipsaw losses significantly, with little effect on total gain. I added this feature to the method.
The second improvement concerns short sales. Davis shorted on all sell signals. Unfortunately, most did not end profitably. Using market breadth (advancing and declining issues on the NYSE) was found to better identify conditions for a short. My first pass modification identified every major downturn since 1961, except the plunge on 9/11/2001 (which was hardly an economically based event), and prevented shorting of many of the smaller corrections. I added this to the method, unchanged from my first attempt.
DATA SERIES
The farther an index moves (in percentage terms), the better it is suited for trend following. Davis probably was aware of this and chose the Value Line Geometric because it did move farther than other indexes available at the time, such as the Dow Jones Industrial Average and the S&P 500. Many small-cap indexes retain this tendency to move farther than their larger-cap cousins and are the basis for ETFs and futures contracts. Currently, there are no ETFs or futures contracts based on the Value Line, so another choice had to be made.
The data series used by the method begins with the Value Line Geometric because there are no readily available small-cap indexes prior to it. But conversion to another index was required before the Value Line fell out of favor. The Russell 2000 currently is quite popular, so a continuous index was created by using the Value Line until the Russell began in 1979, then splicing the Russell onto the Value Line.
TESTING
The algorithm is controlled by three parameters. Two of these are buy/sell thresholds, and the third is the slope of the trend line. The algorithm could be optimized via backtesting, but a forward test is far better. The typical automated trading method uses (or at least they did, for a very long time) a large number of parameters and the method is optimized by backtesting on a great deal of data to determine the best set of parameter values to use. These methods work fabulously on past data when thus optimized, but soon begin to fail on future (out of sample) data. A forward test, where results are recorded entirely on data that the method has not used for optimization, provides a far better indication of how a method will perform in the future.
The forward test began by “training” the algorithm on the S&P 500 data from 1942 through 1960: all possible combinations of the three parameters were applied by the algorithm to the S&P 500 data, and the values that produced the best results were chosen. These parm values then were used for the first trade on the Value Line/Russell 2000 data series, and the result of that trade was recorded as the first result of the forward test.
For the next trade, the algorithm was trained by running the Value Line/Russell 2000 data series from its the beginning to the end of the first trade, with all possible combinations of the three parameters, and choosing the values that produced the best results. These parm values then were used for the next trade on the data series, and that result was recorded. This process was continued for all of the data in the series, beginning each training session with the start of the series data and ending at the end of the last trade.
RESULTS
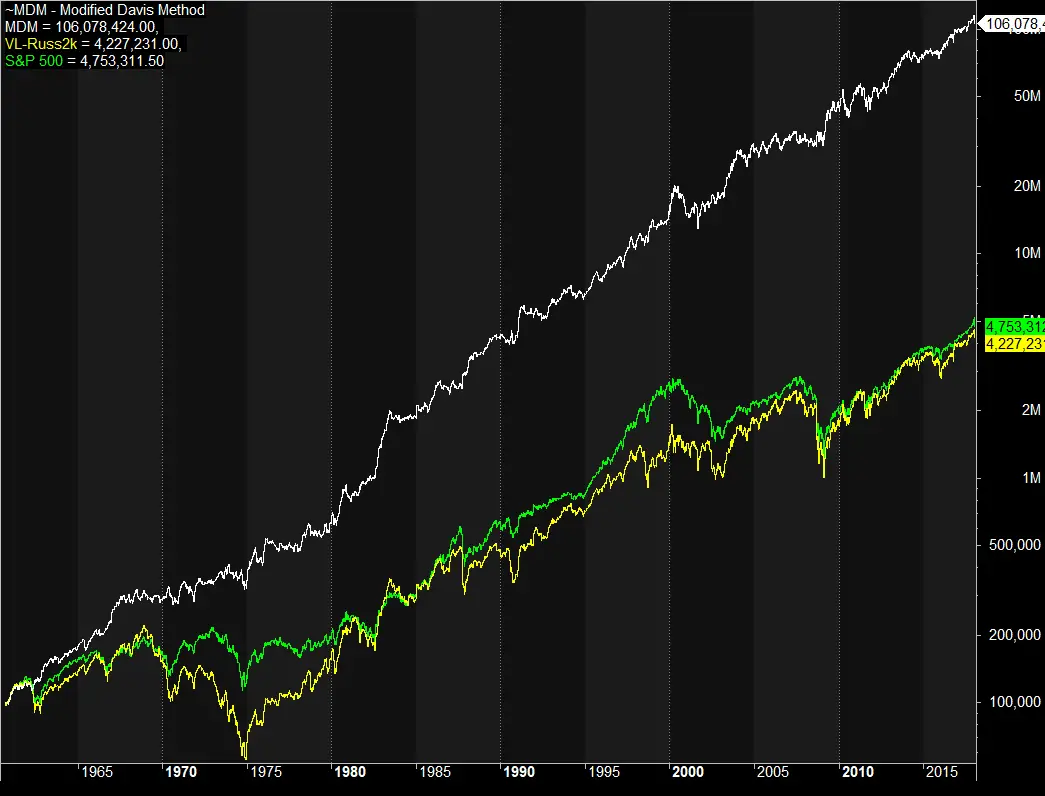
The results are quite impressive: close to 14% average gain per year since 1960, with a maximum drawdown on closed trades of about 26%. Dividends and money market interest would boost this annual gain to over 15%. For comparison, buy and hold of the S&P 500 (excluding dividends) averaged 6.5% per year over the same period with a maximum drawdown greater than 40%.
The accompanying chart shows the results. The upper (white) line is the method; the lower (yellow) line is the Value Line/Russell 2000 index. For comparison, the S&P 500 is shown as the green line. These are results through 9-Feb-2018. In the forward test, the method traded about 3-4 times per year, winning on 54% of all trades. Its win/loss or payoff ratio is 3.98.
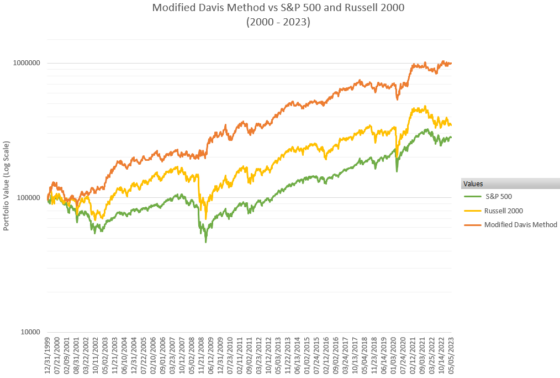
The next chart zooms into the period from 2000 to 2023, with each portfolio starting with $100K.
The next two charts compare the Russell 2K index to Frank’s method, resetting Frank’s portfolio to match the Russell 2K’s value starting in July 2009. The first chart uses a linear vertical scale, the second uses a logarithmic vertical scale.
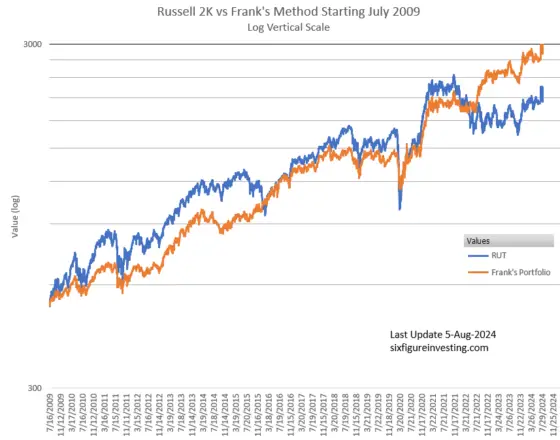
Since 2009, Frank’s method has outperformed the Russell 2K on two important parameters in addition to absolute returns: realized volatility, and maximum drawdown.
| Realized Volatility | Maximum Drawdown | |
| Russell 2k | 23% annualized | -43% |
| Frank’s Method | 16% annualized | -25% |
RISK OF RUIN
Risk of ruin for this method, as defined in The Risk of Ruin Tables You Should Know, is quite low.
To compute the risk of ruin value we need this information:
- Risk per Trade
- Payoff Ratio
- Win Ratio
The method’s Risk per Trade is difficult to estimate. Its average loss is about 2.8% but its maximum loss has been 7.25%. In 190 trades it had only 3 losses greater than 6%. We must interpolate between the 10% and 5% Risk per Trade tables.
Rounding the Payoff Ratio to 4:1 and the Win Ratio to 55%, the 10% table gives a Risk of Ruin of .0438 and the 5%, a Risk of Ruin of zero. So the method’s Risk of Ruin is greater than zero but quite low.
I will be posting future trades here as soon as possible after the close on the day they occur—usually on the next trading day. Stay tuned if you’re interested.
Vance & Martin,
About the time of these comments last year, I had begun fighting Stage 4 Non-Hodgkin’s Lymphoma and had to ignore the market for several months. Fortunately I am now in remission. However, I have more or less given up on Russell 2000, and have begun using my method on NDX and SPHB, both of which have worked much better recently than continuing with Russell. But there is not enough data available for either of these to do the type of historical out-of-sample test that I did with Russell. So I simply have back tested both of these. I am concentrating on SPHB where I really like the results. For example, the SPHB method went 50% short on Feb. 28 at 86.87 and reversed to 100% long on Apr 11 at 73.14. Today (6/25) SPHB closed at 95.32. When I have time, I will post more results here. Sorry for the discontinuity. -Frank
Hello Frank, only today do I see this. Thanks very much for the update. And my sincere best wishes for your ongoing health. Holiday greetings, Martin
August 5 here, and (unless I err), the allocation to stocks has been reduced to 50% — but backdated to August 2. What gives?
Hi Martin,
Frank reports his moves to me after the fact, sometimes as much as a week later. This latest move, the 2-Aug move, he reported to me on the weekend, and I didn’t post/tweet about it until Monday. Frank is not selling this as a service, and neither am I. If you think either Frank or I are cooking the data feel free to ignore the moves.
Vance
thank you for your quick reply, Vance.
When somebody asks a legitimate question, I don’t think making assumptions about their motivation is helpful; in fact it comes across as defensive.
My point would be that adding after-the-fact buy and sell signals undermines the arguments of this webpage. It’s like a brilliant political analyst who publishes his wonderfully accurate predictions a day after the election. He’s still brilliant, but who is gonna believe his methodology is useful?
Vance & Martin,
About the time of these comments last year, I had begun fighting Stage 4 Non-Hodgkin’s Lymphoma and had to ignore the market for several months. Fortunately I am now in remission. However, I have more or less given up on Russell 2000, and have begun using my method on NDX and SPHB, both of which have worked much better recently than continuing with Russell. But there is not enough data available for either of these to do the type of historical out-of-sample test that I did with Russell. So I simply have back tested both of these. I am concentrating on SPHB where I really like the results. For example, the SPHB method went 50% short on Feb. 28 at 86.87 and reversed to 100% long on Apr 11 at 73.14. Today (6/25) SPHB closed at 95.32. When I have time, I will post more results here. Sorry for the discontinuity. -Frank
Hi Frank,
thank you so much for sharing this intriguing strategy. Very impressive.
Is the current 100% position still in place?
And will you or Vance ever inform us if you decided to discontinue updating this page?
As far as I know Frank is still at 100%. I will be sure to do an update if Frank decides to stop updating me. — Vance
thanks a ton, Vance!
Hi Vance, Congrats for your blog and thanks to share it with us.
Just a question, why you / Frank publsih the signals one month later it occurs ?, ….In this way it is very easy to be a good market timing performer ¡…haha¡.
Brds-
Hi Luis,
Usually, I post the update within 3 or 4 days of when Frank gives me the update. In addition to updating the blog post I tweet out the updates on @6_figure_invest.
Vance
Many thks Vance for your response¡. Just a suggestion, on Friday 04 nov 2023 was a status change but it would be great to let the date to stamped as there is a status change, otherwise the method cold be not considered confident one. Rgds-
Are there any updates to the premise of this article? When reviewing returns over the last 12 years, it appears that a buy and hold strategy would have performed better. Curious to hear any new thoughts on this method.
Hi Jack, I have not heard from Frank since the last update to the post. I think he did very well investing over the years and I think when his method stopped working well with corrections towards the end of his updates he didn’t want to go through the effort of reworking his method. I think there are patterns in the markets that work for a while but I don’t think any are structural. By that I mean that these patterns (if they really exist and aren’t just noise) are not inherent to the market and will be arbitraged away if enough people try to implement them. For example, in the past I’m pretty sure there were profitable day of the week, or end of the month strategies in the market. As people/software have gotten better at finding these patterns then they get exploited and are ultimately extinguished by market participants. I think the recent failure of factor investing is the most recent example of this.
Vance
Hi Jack,
I have explained to Vance what happened and I think he is working on an update. In mid-2020 I discovered that a version of my method on NDX worked better than the method on Russell 2000 so I switched to using that. However, there was not nearly enough historical NDX data to create an extensive out-of-sample test article as I had done for Value Line/Russell 2000. But the VL/RUT method kept on working and I have sent those results to Vance.
It so happens that the original 4% method as defined by Ned Davis 40 years ago turned in a stellar performance over a little more than the past year. You can see this for yourself by collecting weekly close Russell 2000 data and doing the computations (buy on any 4% or greater rise, sell & short on any 4% or greater decline). Results:
20211126 – 20220318 Short. +7.7%
20220318 – 20220408 Long. -4.4%
20220408 – 20220527 Short. +5.3%
20220527 – 20220610 Long. -4.6%
20220610 – 20220624 Short. +1.9%
20220624 – 20220826 Long. +7.6%
20220826 – 20221021 Short. +9.2%
20221021 – 20221209 Long. +3.1%
20221209 – ?? Short.
Net gain = +7.7% -4.4% +5.3% -4.6% +1.9% +7.6% +9.2% + 3.1% = +25.8%
The weekly close cover & buy pt is 4% above the 12/16/2022 close of 1763.42, or 1833.96.
Consider all the complaining about the 2022 market and all the declining portfolios. Then contrast that with what only weekly data points and 5th grade arithmetic did, using an extremely simple method defined 40 years ago.
Frank have you revised your position on the S&P 500? Or are you still long at the moment (9/3/16)?
Great articles by the way.
Frank is still long.
Frank – You referenced trades from 2010 and 2011 in the comment section of your previous article “Guest Post: Modified Davis Method—March 2014 Update”. However, these trades are not referenced in the summary above. Why were these trades not included? Has your method been altered since 2010?
JJ, No, nothing about the method has changed since I created it in 2008. Actually, Vance created and has maintained the summary above.
I think his idea was to record the method’s performance in real time going forward from the date of the first article, sometime in 2013. The first sell after the article was published here took place on 11-Apr-14, so Vance included the date and r2k value of the purchase that was then sold. That was a 50% sell, so the portion that was sold was the portion that had been purchased on 30-Nov-12.
There was a 100% sell on 18-Jul-14. 50% of that had been purchased on 6-Jun-14 and the other 50% had been purchased on 17-Jul-09. Everything that was purchased between 17-Jul-09 and 30-Nov-12 was sold before the article was published, so those trades are not part of the real-time post-publication record.
I realize that this is confusing and I think Vance did quite well to figure this out on his own. I don’t think he asked me about this before he published it. When the method gets in the mode to buy and sell only 50%, it holds the oldest 50% position until a 100% sell occurs, so as to increase the probability of capturing a long-term gain. That part, at least, ought to make sense.
Awesome work Frank!
Hello uwm, The forward test trades future data using the buy & sell thresholds that have worked the best on the past data. It so happens that, over time, 4% is almost never the best value. Early in the testing period, values below 4% worked best, then higher values were chosen. There are many ways to construct a trendline, the one that I use happens to work very well. I would suggest that you try different ways on your own and see what you get.
Great article – wonderful work. When will you be in publishing your trade recommendation?
Hi Chuck, I’m not sure exactly what you’re asking. I have no plans to publish trade recommendations beforehand. Noting signals of my method shortly after they occur will, over time, document the value of this approach. I hope that it encourages others to do their own research and develop their own methods, as I believe that the best method for YOU is one that YOU create yourself.
What are the possible invested positions for MDM? 100% long, 50% long, cash, 50% short, etc. How do you determine these?
Terrific work Frank…..
Hello curtis6337,
Thank you. The precise details I consider proprietary so don’t want to reveal them. But for anyone who has spent time studying the results of the original 4% method and noticed its shortcomings, I think that I have suggested ways for such a person to study that can prove to be beneficial.
One thing I use in parameter selection I got from an unsolicited ad, called the “AbleSys Index”. It measures the performance of a system, evaluating to a positive number in the vicinity of 1 or so. The ad says that systems with an Index of 1.2 or higher are “tradable”. I get values 10 times higher than that, which I consider to be consistent with the very low risk of ruin estimate I mentioned. I also have run some statistical analyses on my results that have comparable implications.
If you’re working on your own system, I encourage you to keep at it and wish you good luck. The riddle of the market can be solved in a profitable way but I think that it takes a lot of legwork.
–Frank
One other thought Frank, Had you considered using moving averages instead of trendlines? I find trendlines to be subjective whereas MA’s, once you set the parameter, are objective.
I have tried many other methods, including moving averages. I never found anything that worked as well as the Davis method, so I have spent almost all of my time on improving that. I defined a very rigid, generalized way to draw a trendline so that it is not subjective. Of course, it is almost always not the best possible trendline, but it does enable the overall system to work well.
Frank, Overall, have your modifications improved returns versus the Ned Davis method or just reduced the number of whipsaws? It would be interesting to see a performance chart of the original method vs your modifications.
Reducing whipsaw losses was so important that I never have gone back to see how the Davis method would have worked over all of the data that I have now. At one point, from about 1966-1985, the Davis method returned about 14% per year, so the 2 methods are probably in the same ballpark.
Here’s one example of whipsaw: in 1976-77 the Davis method incurred about a 23% cumulative loss over about 18 months. My method over the same period incurred less than a 9% cumulative loss.
Another example you can try for yourself. Try the Davis method on the Russell 2000 for 2000-2001. I was trying to do the Davis method myself then and I simply gave up, the whipsaws were so severe.
In fact, you can run the Davis method on all the Russell 2000 data from 1987-present as it is available online, and see how the resulting equity curve compares to mine. I’m sure that my method’s equity curve is smoother.
You can easily verify recent Davis method behavior yourself. Both my method and the original Davis method bought at Russell 2000 821.92 on 11/30/12. Since then Davis has switched between long and short twice while my method has stayed 100% long. As of the 9/20/13 close of 1072.83, Davis has returned net +9.3%, my method has returned net +30.5%.
This is something of an anomaly, the difference usually is not nearly this great… but it has been very profitably fun to be 100% long since last November while numerous “experts” have called the top many times along the way.