The CBOE’s VIX index gets mainstream exposure as the “fear index”, but there’s a lot more to volatility watching than the VIX. The VIX does a good job of measuring the current level of anxiety in the market, but it has some problems. Among other things it’s:
- Not a good predictor of the future
- Often does not move in the direction people expect (opposite the S&P 500). Historically its average percentage move is -4.77x of the S&P 500, but around 20% of the time it moves in the same direction.
- Not investable—it’s a measurement, not a security
- Quirky around weekends and holidays
- For a comprehensive look at the quirks of the VIX see No, The VIX is Not Broken.
There’s almost an overwhelming number of things to watch with volatility, but a few straightforward concepts can help you observe intelligently.
Option Implied Volatility (IV)
- The market’s estimate of a security’s future volatility is reflected in the price of its options. In practice the market isn’t always logical about this, for example, out-of-the-money (OTM) puts usually have higher expected volatility than at-the-money (ATM) puts even though they are all based on the same security.
- If an option expires in 60 days, we assume that its pricing reflects a 60 day expectation of volatility in the underlying security.
Implied Volatility Skew
- When the market is especially fearful the IV of OTM puts goes way up because investors are buying options for portfolio insurance. The difference between IVs at different options strike prices is called skew. A partial measure of SPX (S&P 500) option skew is incorporated into the calculation of the VIX index. The CBOE also does an explicit skew calculation. Details of that calculation are given here, and a spreadsheet with historical daily values can be downloaded here.
Duration
- Volatility measures are either variable or constant. The VIX is a constant 30-day future estimate of volatility. SPX options, VIX futures, and VIX options all have variable durations because they expire on specific dates. While the volatility directly or indirectly expressed by these securities does not necessarily go up or down with the passage of time, they tend to get tweaky a few days before expiration.
Blends or Single Security
- The VIX is an index that blends together the volatility characteristics of a wide range of SPX options. Most measures (e.g,, VIX futures prices) give a volatility measure for a single security.
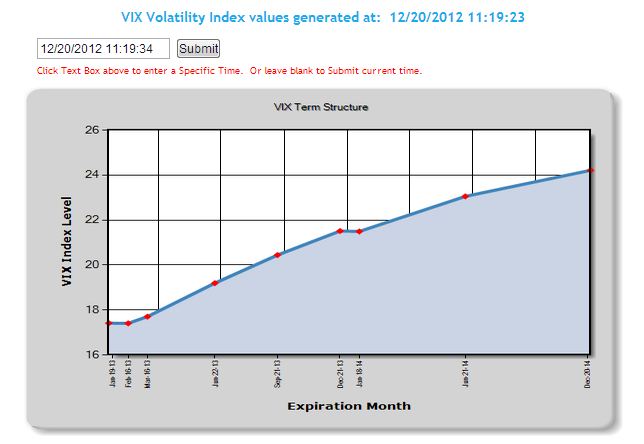
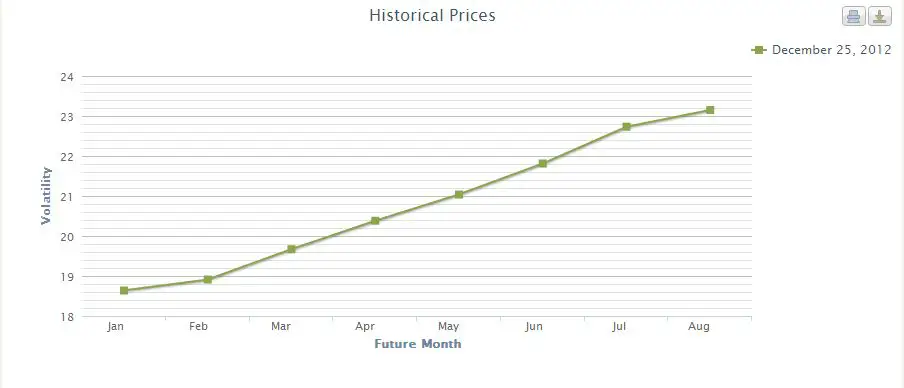
Term Structure
- While the VIX has a 30-day duration, it’s useful to look further out in time for other volatility estimates. The CBOE also provides VIX9D, VIX3M , VIX6M, and VIX1Y which are 9 day, 93 day, 184 day, and 360 day expectations of volatility. SPX options give estimates up to two years out, VIX futures 9 months, VIX options 6 months. Different patterns (e.g., steadily rising estimates of volatility vs declining) over time indicate how nervous the market is, regardless of the absolute values of volatility.
- When the term structure is climbing over time (positive slope) it is said to be in contango, if declining over time, backwardation.
Rolling Indexes
- All exchange-traded volatility funds (ETF/ETNs) rely on volatility rolling indexes that are blends of various VIX futures. This blending achieves a constant duration estimate of volatility and is done in a way that can be physically traded. Unfortunately, the typical term structure of the VIX futures creates an erosion effect on this mix of futures. The end result is that these indexes are only good at tracking volatility moves in the short term. Long term these rolling indexes inexorably trend towards zero.
- Examples:
- SPVXSTR –1 & 2-month rolling VIX futures (e.g., VXX)
- SPVXMTR (4-7 month rolling VIX futures (e.g., VXZ)
- For other ETFs/ETNs volatility indexes see Volatility Tickers
The chart below summarizes the S&P 500 volatility measures that I monitor. Click on the ticker for quotes (Yahoo! Finance) for more information.
| Duration | Securities |
Term Structure |
|||
| Short Term (1-2 month) | 3 Month | Mid-Term(4-7 month) | Long Term | ||
| Constant | Blend | ||||
| VIX/VIX3M ratio (when below 1 indicates contango) | |||||
| Single | Historical Volatility (e.g., 22-day retrospective) | ||||
| Variable | Blend | Per-expiration month SPX option volatility computed using the VIX’s option strike composite approach for months 3 through 10 | |||
| Single |
|
||||
Notes
- VVIX is a VIX-like index derived from the IV of VIX options—creating a mind-bending volatility of volatility measure.
- Historical or realized volatility is computed using past changes in the security. The historical volatility is often compared to the implied volatility to determine the difference. Implied volatility is almost always higher than historic volatility.
- VIN and VIF are variable duration metrics created by the CBOE for use in calculating the VIX index. The “N” in VIN stands for “near”, and the “F” in VIF stands for “far.” The VIN is calculated from the set of SPX weekly and monthly options whose expirations bracket the VIX’s 30-day expectation. The VIF is calculated using the SPX options that expire the week after the VIN options. See this post for calculation details.
Thanks, very helpful.