There are lots of valid ways to look at the market. Obviously, price is important, but a number alone (e.g., 1487.85—the Feb 25, 2013, S&P 500 close) doesn’t mean much. Price related metrics like percentage changes and support/resistance levels add value, but adding time as a factor enables some really interesting measures like moving averages and momentum trackers. My favorite time-related metric is term structure—how the prices of various options and futures vary depending on their expiration dates.
The February 25th,2013 market action provided a very interesting set of views.
On the price dimension, the percentage moves of the S&P 500 (SPX) and the CBOE’s VIX® index were unusual. At 3:41 EST the SPX was at 1497.7 down 1.21% from the previous close. The VIX on the other hand, was up 26.7%, which was -22X the SPX move. The average move is -4.77%, so this was a tad unusual.
On the time dimension, the term structure of SPX options was moving rapidly into backwardation—the implied volatility of the near term options climbing dramatically compared to longer-dated options.
At open: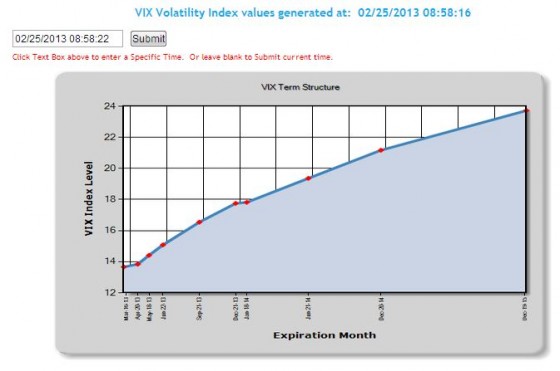
At 3:26 EST: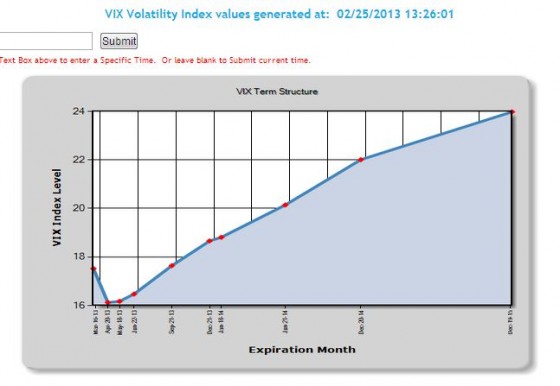
Options in general and SPX options, in particular, are thought to be traded by more sophisticated investors and institutions. This sort of term structure change indicates they were buying option based protection like mad—even though the market had only fallen 1.21% at the time.
The third dimension that I like to watch is how different markets react to the same set of circumstances. At 2:44 EST the VIX futures market was still unimpressed with the SPX price action of the day—with the term structure looking almost ruler-straight.
The March front month VIX future was only up 5.4% even though the VIX was up 16.7% at that point—and almost equal to the 3rd-month future price. The term structure looked a little different at the market close.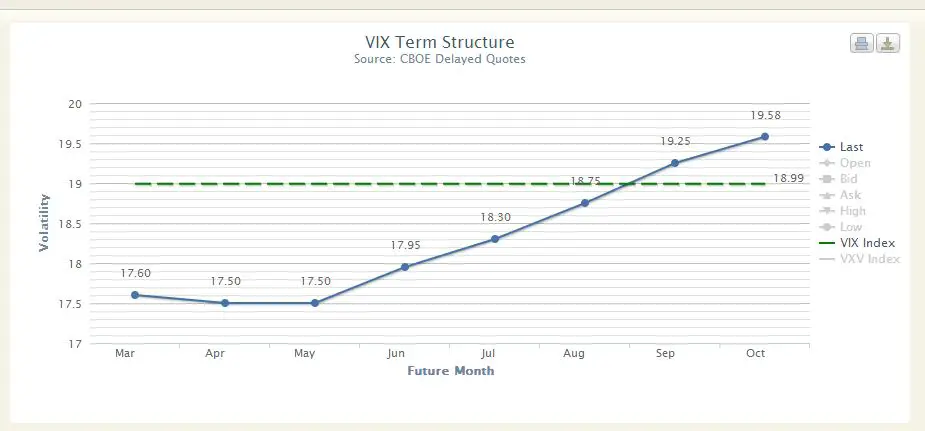
It shows a dramatic shift into backwardation.
Although VIX futures are also linked to SPX options, the linkage is pretty weak. The front-month futures only reliably align with SPX options once a month—on the future’s expiration date. Far fewer investors trade VIX futures and they are likely more sophisticated than SPX option traders. Clearly, the VIX futures market at 2:44 EST was much less impressed with the general market pullback than the SPX options market.
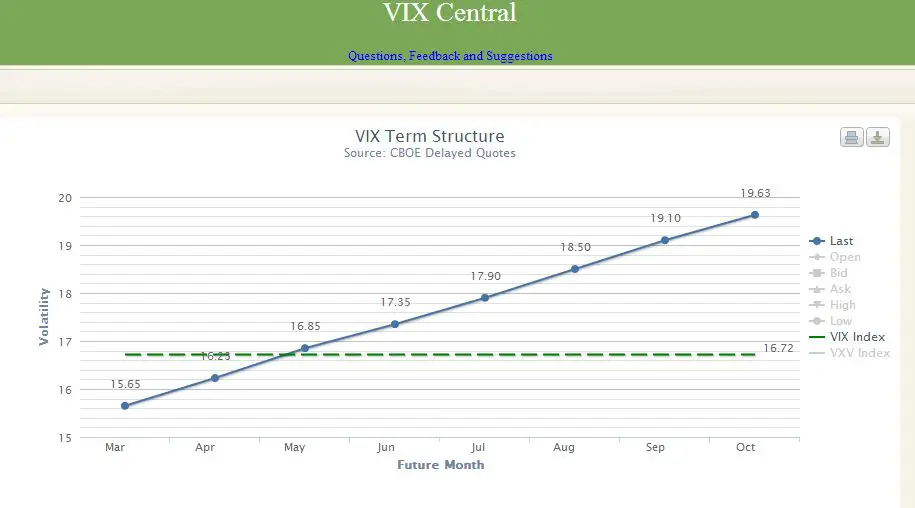
By market close the VIX futures market was serious about the market move, but judging by the position of the VIX close above the 6th (!) month VIX future value the VIX futures market is still not that worried.
The chart below shows the situation at close on February 26th: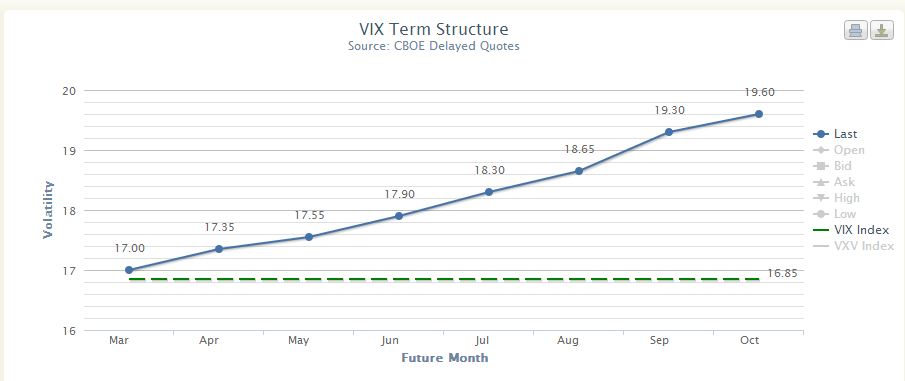
The VIX dropped 2.14 points, 11%, and although lumpy the VIX Futures term structure straightened out. For at least 26th the VIX Futures crowd called it right.
hello,
how to handle which one is right ?
Would it be better to use VIX Term Structure instead of VIX Futures Curve ?
the fact is that when i look at vixcentral.com, i noticed that the first date when we went from backwardiation to almost contango was at the date of May, 8…
On the other hand, if you look at VIX term structure deformation, you can notice that the shape of term structure went to contango at the date of 5 of May… three days in advance! http://www.cboe.com/trading-tools/strategy-planning-tools/term-structure-data
we would have prefered to be long SPX on 5 of May instead of 8…
that time it is VIX term curve which was right…
do you have a better view on that?
Long term I don’t think there is a case for one or the other to be a better signal. Historically I think the VIX term structure has tended to come out of backwardation before the VIX futures does, but for example, this week shows that is not always a good predictor. If you are using the front VIX futures in a ratio as a signal then I think there is an issue when as the future nears expiration. The typical premium of the VIX future over the “spot” VIX drops rapidly the week before the future expires. I think that drop-off tends to influence the term structure more than it should. It makes it look like the term structure is shifting but if you look at the 2nd to 3rd month structure it remains unchanged. Something to be aware of.
Vance