I have generated the end of day trading day values for the most popular long and short volatility Exchange Traded Products (ETPs) for March 26th, 2004 through the end of the most recent quarter. See this table for specifics.
- +1.5X UVXY ProShares Ultra VIX Short-Term Futures ETF (includes old 2X simulation)
- VXX Barclays S&P 500 VIX Short-Term Futures ETN
- VXZ Barclays S&P 500 VIX Mid-Term Futures ETN
- -0.5X SVXY ProShares VIX Short-Term Futures ETF (includes old -1X simulation and XIV simulation)
- VIXY ProShares VIX Short-Term Futures ETF
- VIXM ProShares VIX Medium-Term Futures ETF
- TVIX VelocityShares Daily 2x VIX Short-Term ETN (only trading on OTC market)
- ZIV VelocityShares Daily Inverse VIX Medium-Term ETN (only trading on OTC market)
These ETP histories are useful if you want to backtest various volatility strategies through the quiet times from 2004 to 2007, or the 2008/2009 crash. The chart below shows the simulated values with a logarithmic vertical axis so that you can see a reasonable amount of information for each fund.
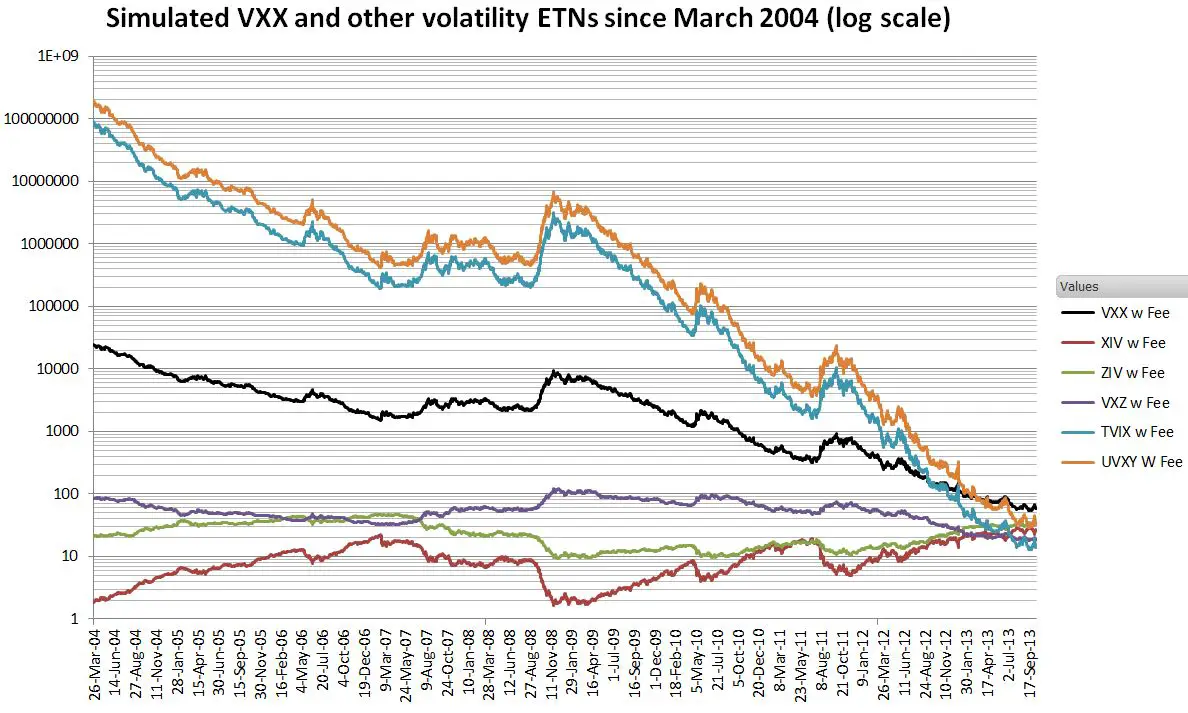
The algorithms for generating these ETPs values are documented in the prospectuses for the various volatility ETNs and ETFs. Barclays’ VXX/VXZ fund prospectus is a good example. See Volatility tickers for the current universe of USA based volatility ETPs and their associated reference indexes. The recent futures settlement data required for these calculations is available on this CBOE website—in the form of 100+ separate spreadsheets. To make the calculation of the indexes underlying the ETPs tractable I created a master spreadsheet that integrates the futures settlement data into a single sheet. See this post for more information about that spreadsheet.
My simulated values very closely track the published indicative values (IV) of the funds. Barclays provides a recent IV values for the series B VXX and VXZ—my simulation tracks them within +-0.05% and +-0.025% respectively. Sampled IV values for the other funds give error terms of +-0.2% for Proshares’ UVXY and SVXY.
If you need simulated intraday open, high, low values also check out this post.
These ETP prices reflect the contribution of 91-day treasury bills on their overall performance. Thirteen-week Treasuries yields averaged 0.05% in 2013, but in February 2007 they yielded over 5%— things have changed a bit… The simulated ETP values do include applicable fees which vary from fund to fund. The fee calculation is surprisingly difficult. For more on that see Backtest on VXX Including Annual Fees
I am making these simulation spreadsheets (values only, no formulas) available for purchase, individually, or as a complete package. The VXX package is also available here. If you cannot see purchase information immediately below then please click this link to the stand-alone post and look at the bottom of the page.
For more information on the spreadsheets see readme.
If you purchase the spreadsheet you will be directed to paypal where you can pay via your paypal account or a credit card. Please email me at [email protected] if you have problems, questions, or requests.
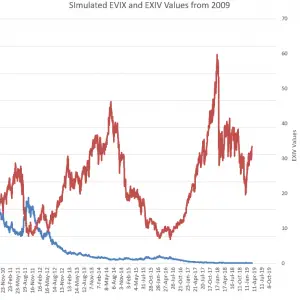
EVIX / EXIV Backtests
$99.00 Add to cart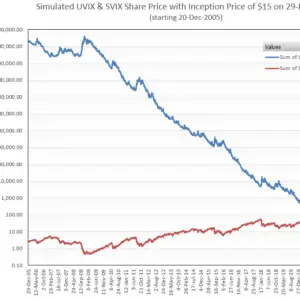
Volatility Shares -1X SVIX, 2X UVIX, and -1X ZVOL ETFs Backtest + Associated Indexes (free)
$0.00 Add to cart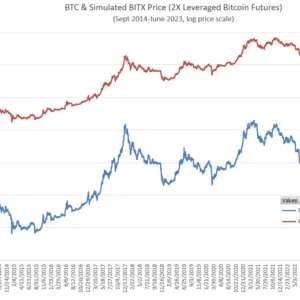
Volatility Shares BITX (2X Bitcoin Futures) & ETHU (2X Ether) ETF Backtests (free)
$0.00 Add to cart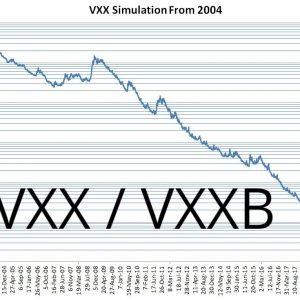
VXX Backtest
$29.00 Add to cart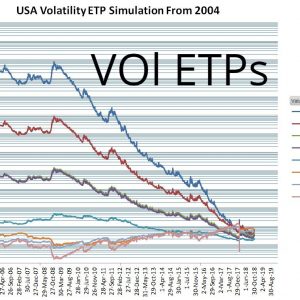
Volatility ETP Backtests
$99.00 Add to cart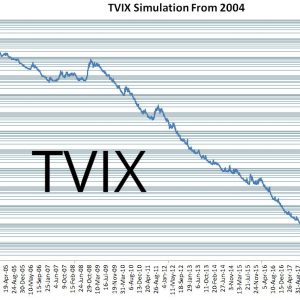
VelocityShares 2X TVIX Backtest
$29.00 Add to cart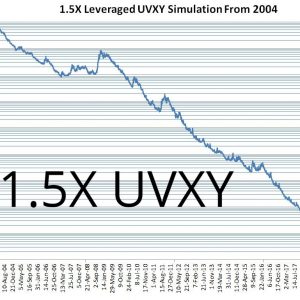
Proshares 1.5X UVXY Backtest
$29.00 Add to cart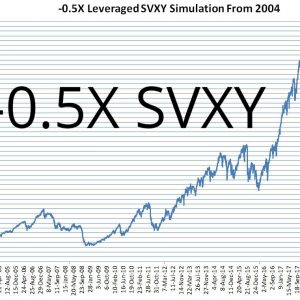
Proshares -0.5X SVXY Backtest
$29.00 Add to cart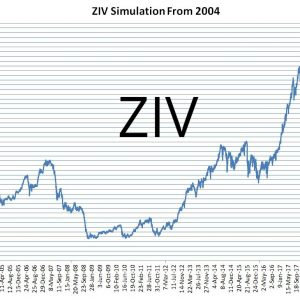
VelocityShares ZIV Backtest
$0.00 Add to cart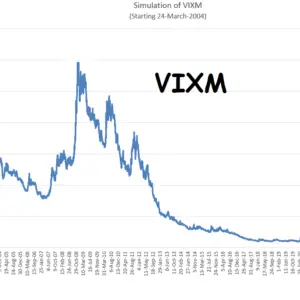
VIXM Backtest
$29.00 Add to cart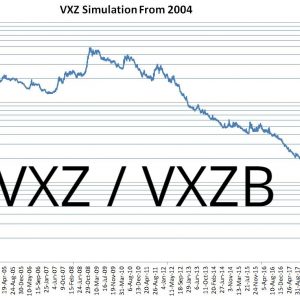
VXZ Backtest
$29.00 Add to cart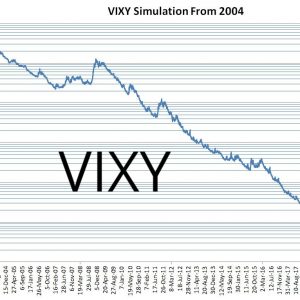
ProShares’ VIXY Backtest
$19.00 Add to cart
https://uploads.disquscdn.com/images/810ffb9296c06fbf50b85cafbd70352dfbb31306dc5edc289ccac5b304b5d0c2.png
i tried to catch the buy moment for the uvxy which is of course also is the sell moment for xiv or svxy
Can someone help me to make it more accurate?
Thanks, Bernard
Hi. Thanks for sharing.
Im also contemplating some volatility ETF trades and would like feedback on if anyone had done/analyzed something similar to what I came up with and how did that turn out.
1. Shorting TVIX XIV pair. I backtested shorting TVIX XIV at a 1:2 dollar ratio with weekly rebalance (can be done on ETFreplay.com). The idea is to cancel out the price risk so I can reap compounding losses of the leveraged ETFs without betting on volatility. It turns out to be a fairly ‘safe’ strategy (at least on paper) yielding a steady 8-15% annually before commissions and ‘hard to borrow’ fees (around 3% at my broker), with maximum draw down <10% except during the 2012 period of TVIX's severe tracking error. I'm thinking with a low-commission broker this strategy may have the potential as a bond replacement as the yield is net positive, not too volatile, and not terribly correlated to the stock market.
2. short TVIX long VXX calls. Im also considering going 'naked' short TVIX and hedge it with deep OTM VXX calls. My exponential regression on historical TVIX is showing me an averaged 0.58% DAILY decline in TVIX price. That's $5.8/day with $1000 invested in short TVIX. 42 DTE VXX calls at double the current VXX price can be had for around 1.5% the price of VXX. Since $1000 in TVIX has roughly the same price risk as $2000 in VXX, the short $1000 TVIX is adequately hedged if I buy enough VXX calls to cover $2000 worth of VXX, thus paying $2000*1.5%=$30 for 42 days, or less than $1/day. I'd be netting a $5 gain per $1000. My maximum loss would be capped at 200% ($2000), occurring in the unlikely scenario of VXX shooting up 100%+ overnight (TVIX up 200%+) . As long as I have $2000 cash on hand and the worst case doesn't happen more than every 400 or so days I should be making money, and a lot of it. That is, unless there's some huge pitfall that I failed to consider
Hi GG, The weekly rebalancing is pretty important in your 1st scenario because of the variable leverage of the short positions. Your analysis seems reasonable.
On your second scenario I think you have missed that if VXX doubles TVIX/UVXY can quadruple. In this recent correction VXX went 2X from 16 to 31, UVXY went from 25 to 85, a factor of 3.4. I suggest you work through a specific example assuming those sorts of moves and see if the VXX calls provide as much of a hedge as you expect. Remember the VXX calls are just at the money if the VXX = the strike price. They don’t provide much hedging power until significantly in the money.
— Vance
Vance, great work as always. Also if you ever create a table that shows how often XIV has drawn down 10%, 25%, 50% or more that would be enlightening. I’ve always heard only buy these on “significant” pullbacks and I don’t think Monday quite counts as I suspect the 10%-15% pullbacks aren’t so rare.
Hi dph, Not surprisingly most of the volatility trading systems suffered in June. http://volatilitymadesimple.com/vix-trading-strategies-in-june/ Thought you might be interested.
— Vance
Very interesting. Which of these strategies, if not buy and hold, would you trade if you we’re inclined to put a small position on and planned to allow it many years (even a decade plus) to be profitable with the expectations of large drawdowns in the interim?
Dave
Hi Dave,
Actually I have not dug into these strategies, so I don’t have an opinion on them. Right now I’m focused on UBS’s VQTS (see my latest blog post). Its simulated drawdowns less than S&P and impressive gains since 2006 (again simulated).
— Vance
Thanks for a great informative post. However, I have serious doubts about your calculations.
XIV, for example, tracks the S&P 500 VIX Short Term Futures Inverse Daily Index. This index was created in 2007 and Standard & Poor’s back-tested the data to determine closing values for this index dating back to December 20, 2005. The closing value on December 20, 2005 was set at 100,000. The closing value of this index on October 15, 2013, the last date in the data calculations above, was 331349.98.
The total gain of the S&P 500 VIX Short Term Futures Inverse Daily Index between 12/20/05 and 10/15/13 was therefore about 231%. However, your calculations indicate that $1000 invested in an XIV product on March 26, 2004 would have grown to $17865 by 10/15/13, a gain of 1686.5%.
Even if your calculations assume that an XIV product exactly tracked the S&P 500 VIX Short Term Futures Inverse Daily Index (which it would not – it would likely trail the target index by about 1.5-2% per year), your hypothetical XIV product would have had to have increased about 439% between 3/26/04, the first date for your calculations, and 12/20/05.
It seems highly unlikely that an XIV product would have returned 439% or more during the 21-month period of time between 3/26/04 and 12/20/05.
Hi Kurk,
I stand by my calculations. I think the core part of your argument is that you think a 439% gain (my number is 409%) from March 2004 to December 2005 seems unlikely. It turns out that period of the market was extraordinarily quiet with a maximum closing VIX of 19.96. In quiet periods such as this the contango losses on the long side are very heavy. My calculations on the long index for short term volatility (SPVXSP) would be a decrease from 590277 to 100000 over that period, which would amount to a 8.8% monthly drop. This is not unprecedented, in the 13 month period between VXX reverse splits from Oct 2012 to Nov 2013 the long side dropped at a monthly rate of 8.5% even though there were 3 VIX spikes of 20 or higher. A glance at the log chart on my post would show other times where the rate of decline in VXX was higher than the simulated 2004 to Dec 2005 timeframe. A compounded rate of 8.8% would give a gain of 487% for an inverse strategy over the 21 month period you mention. Volatility drag would decrease the realizable amount by some, but the compounding benefits of a trending security https://www.sixfigureinvesting.com/2012/10/a-hat-trick-for-inverse-leveraged-volatility-funds/ would tend to counteract that–so the 409% value is reasonable.
My simulation tracks the actual XIV IV values within +-0.2% since inception and it tracks the underlying index (SPVXSP) within +- 0.01% to the Dec 20th 2005 index start value. So I think it is highly unlikely my methodology is incorrect. The biggest uncertainty in that 2004 to 2005 timeframe is that in some timeframes the front month futures were not being traded. I used an variance based extrapolation to project the front month values in those cases. The resultant values are within historic term structure ranges.
It turns out that XIV is based on the SPVXSP index not the SPVIXSTR index you mentioned. The differences are not large, but the one you mentioned is a total returns index which includes a treasury bill component that SPVXSP does not have.
— Vance
Vance, thanks for your reply. All other things being equal, if the interest rate on treasury bills are higher than they are now, like they were back in 2004 and 2005, do you think that an XIV product would decrease faster than it would if the interest rate on treasury bills are low, as they are now?
Oops, I mean, would an XIV product increase, not decrease, more quickly if the interest rate of treasury bills were much higher than it is now. If so, I suppose that VXX might be an even more attractive short than it is right now in that scenario.
Hi Kurt,
Since XIV is based on an index that doesn’t have treasury bill exposure it would have no impact on XIV. If an inverse ETP like XIV was based on SPVIXSTR which has T-bill value add,, then I would expect it to out performance XIV when t-bills are yielding higher interest.
— Vance
Ok, thanks Vance. I will definitely check out this blog periodically in the future – you have a wealth of information relating to VIX products here!
Vance, in your opinion, how do think think that a product such as XIV would have performed during the seemingly drawn-out bear market between March 2000 and the market lows in either October 2002 or March 2003?
Vance,
I’m very impressed with your blog. May I ask you thoughts on long term holding XIV? Would you add after certain drawdown thresholds and/or MA crossovers? Can you imagine putting 10%+ of one’s portfolio into something like XIV assuming some risk management?
Hi dph, A lot of effort has gone into finding systems for trading volatility products, see this blog http://www.tradingvolatility.net/p/home_3.html for some good examples. I”m not super enthusiastic because most/all of these trading systems rely on historical patterns that aren’t based in economic realities, but happen to be consistent in the past. Plus they haven’t had to deal with a true bear market yet, which will be a big test–the drawdown in XIV will be huge. A 10% portfolio stake is not ridiculous, but it would come with a lot of challenges emotionally.
— Vance
Vance are you skeptical that systems that enter/exit based on the contango dynamic will perform going forward because of whipsaws? Or do you think eventually one likely gets caught in a large overnight drawdown (which would suggest that Futures might be a better way to move in and out of these)?
Hi dph, In general I don’t think the past is predictive of the future, so any enter/exit signal that’s not based on an economic reality will eventually fail. The overnight spike is an extreme version of the unpredictable event, this is a significant risk for anyone that’s systematically short volatility. I don’t see where futures are any better regarding this risk, it seems to me that they have the same risk factors.
— Vance
Vance early you stated your not super enthusiastic about volatility “systems” does that suggest that they maybe their not much better than just shorting volatility in the long run? Or can a simple ratio of when to be long (or avoid) XIV perform nearly as well without subscribing to a model?
Also, I mentioned futures since they have deeper liquidity (and market hours) than ETNs. Yes the overnight black swans will hit them too but maybe a few traders got out Sunday/ Monday before the thrashing of the US based etns where it was already too late.
“” I”m not super enthusiastic because most/all of these trading systems rely on historical patterns that aren’t based in economic realities, but happen to be consistent in the past.””
Hi dph, The biggest advantage of systems is that they remove emotion and day to day re-evaluation requirements. The downside is that most of them will not work well over the long run. In general I think being short volatility is a tough trading challenge–relatively small profits, big drawdowns, and changing landscape over time.
— Vance
Vance,
For XIV to continue to prosper in the long run does it need declining volatility or just quiet (ie stable) volatility even if VIX levels normalize above their 2014/2015 values?
Hi dph, For XIV to do well the VIX futures term structure needs to be in contango most of the time. This has been the case 75% to 85% of the time and probably won’t change. The other enemy of XIV is a lot of choppy action in the market. Because XIV is a daily resetting fund choppy action tends to erode the value of the fund (e.g., 1% down followed by 1% up does not get you back to where you started).
— Vance
So just buy and hold XIV and buy more share if it goes down by e.g. 50%? Could you do a backtest for that, on which drawdown is the best point to buy again?
Hi Vance, so it looks like XIV/SVXY is a great long term buy and hold IF you can weather the 90%+ drawdowns in 2008- style market meltdowns? (even more so if you average down)