The CBOE’s VIX® methodology calculates a single theoretically grounded number that quantifies virtually the entire volatility landscape for a specific point in time—pretty cool. Prices for hundreds of different options with different expiration dates can be involved in the calculation. This single number is very useful, but obviously, lots of information is discarded in the distillation. I’ve wondered if the VIX’s compression is hiding some information on the values of volatility over time—the term structure. So I’ve done a little digging into the details of option pricing.
But first some background. The CBOE provides an online chart that shows the results of doing the VIX calculation on standard SPX options (S&P 500) listed out over the next two years. Unlike the standard 30-day VIX these calculations are tied to specific option expiration dates. For example, the chart below has options that expire anywhere from 15 to 834 days from the September 4th, 2013 snapshot date. The CBOE interpolates between VIX style calculations based on SPX options with between 23 and 37 days until expiration to calculate the 30-day VIX and interpolates between the 3rd and 4th months to generate the 93 day VIX3M. For more on this see Calculating VIX—The Easy Part.
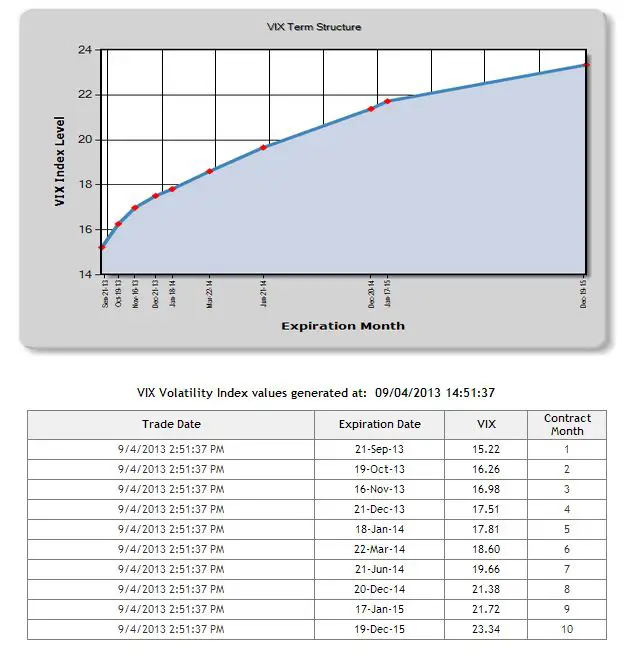
One of the striking things about this graph is the dramatic upward slope of VIX values over time—with the December 2015 value being 50% higher than September 2013’s. The Nobel Prize winning Black and Scholes options pricing model asserts that this volatility curve should be a horizontal line—it’s fair to say that there’s a difference of option between theory and the market.
One interpretation is that the market is predicting increasing volatility in the future, but volatility is always spiking and declining over time—it never acts like a hot growth stock in its glory days…
Most theoreticians agree that the market is compensating for a weakness in the Black and Scholes model—which assumes that the market’s returns can be accurately modeled as a Gaussian or Normal distribution (actually lognormal if you’re being picky). The reality is that market panics create Fat Tails (Black Swans if you are a Taleb fan) that invalidate that assumption.
VIX Futures follow a similar curve, the graphic below is from VIX Central, but the futures only go out for 9 months.
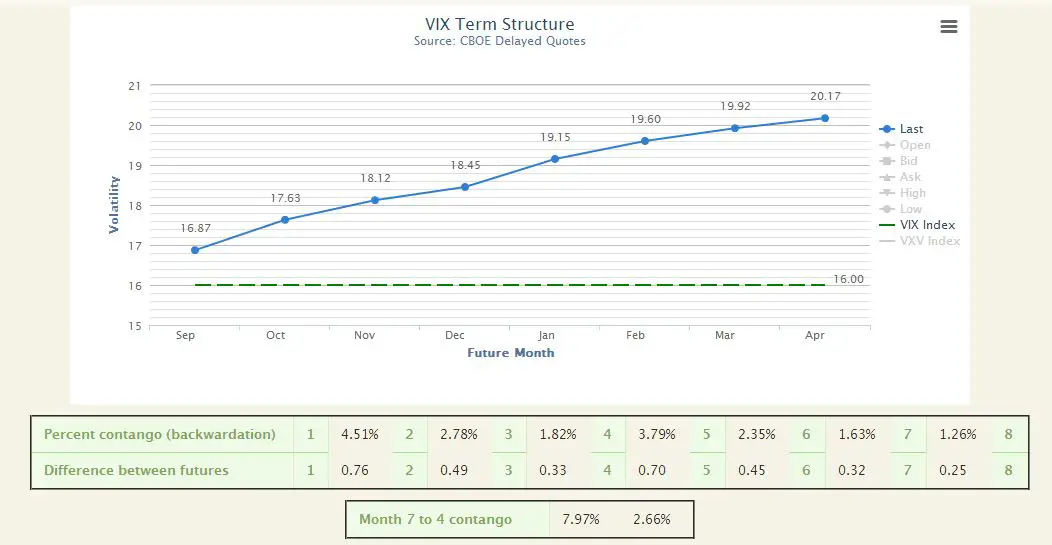
Typically the VIX Futures volatility values carry a 3% to 9% premium over the equivalent SPX options VIX values. A premium I attribute to the costs of arbitrage.
Enough background already…
I was curious how much these widely disparate volatility values over time impacted the price of the options themselves. On September 4, 2013, I took a snapshot of two sets of SPX put options, those with a strike prices currently at-the-money (1650), and another set that was about 10% out-of-the-money (1475). The graph below shows the actual prices for the ATM options, and the prices the Black & Scholes model predicts with an implied volatility (IV) of 16 over the next 15 months (dotted line). I chose 16 as the target volatility because that was the 30 day VIX value when I captured the data.
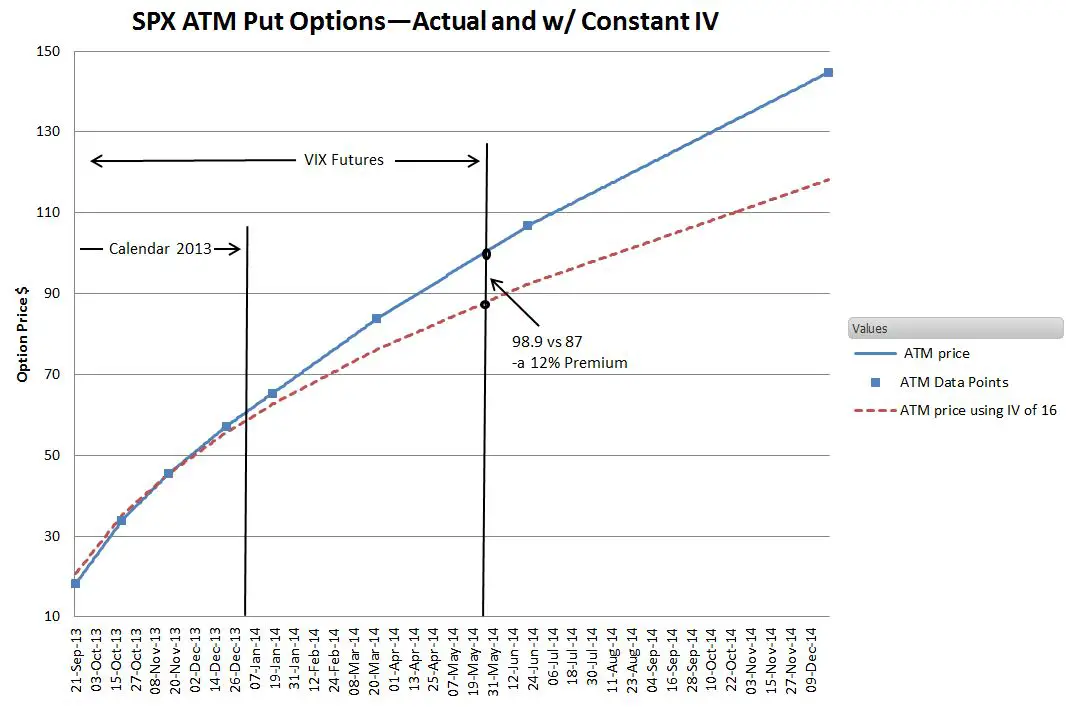
In spite of a 21% ramp in volatility over the span of the VIX futures (from 16.87 to 20.4) the ATM options are priced nearly identical to the baseline during calendar 2013 and only diverge by 12 percent 9 months from now. Clearly, ATM options prices are not driving the term structure. The next chart shows both the ATM and OTM option prices over the next 27 months.
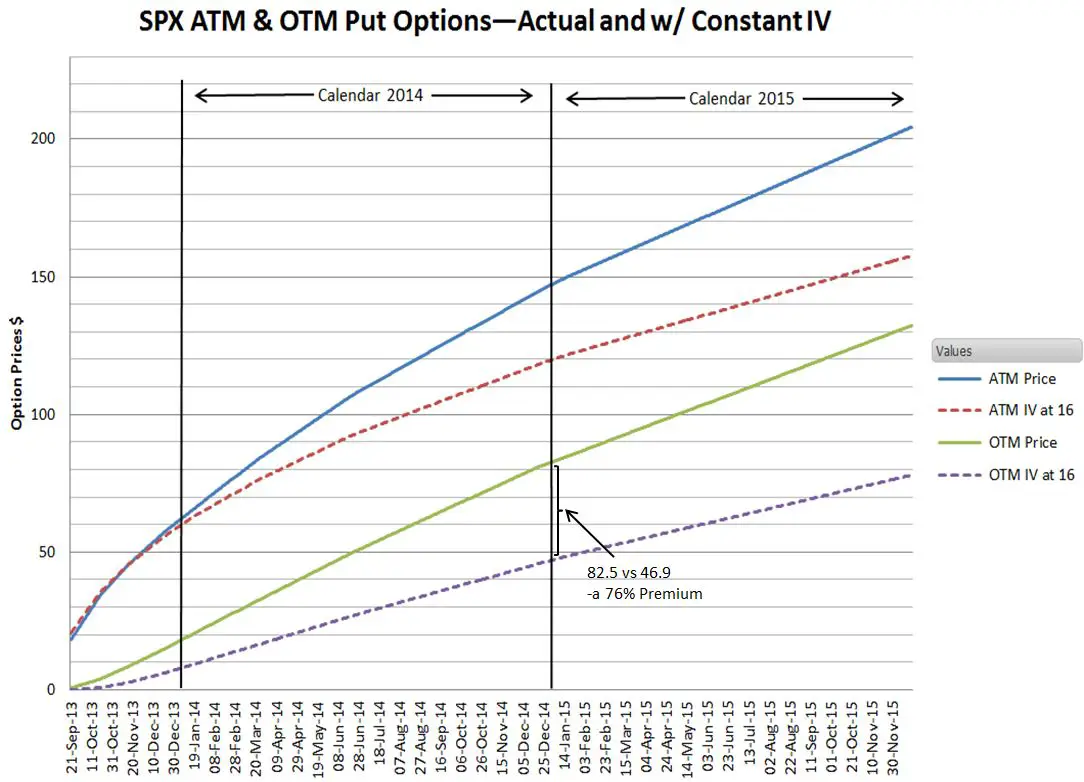
The OTM options have dramatically higher premiums in the short term over the baseline and premiums in the 70% range for a year or two out—these premiums boost the implied volatility of the term structure. Some people wonder about the robustness of this price structure. If lots of people try to go short on volatility will that change the status quo? With options, the open interest is a good indication of the robustness of the market. By that measure SPX options look good—for just the two strikes 1650 and 1475 the open interest for all expiration dates totalled over 300K contracts for 1650 and over 180K for 1475. The notional value of the options is greater than $50B and $27B respectively.
The next chart switches back to a volatility based view of things.
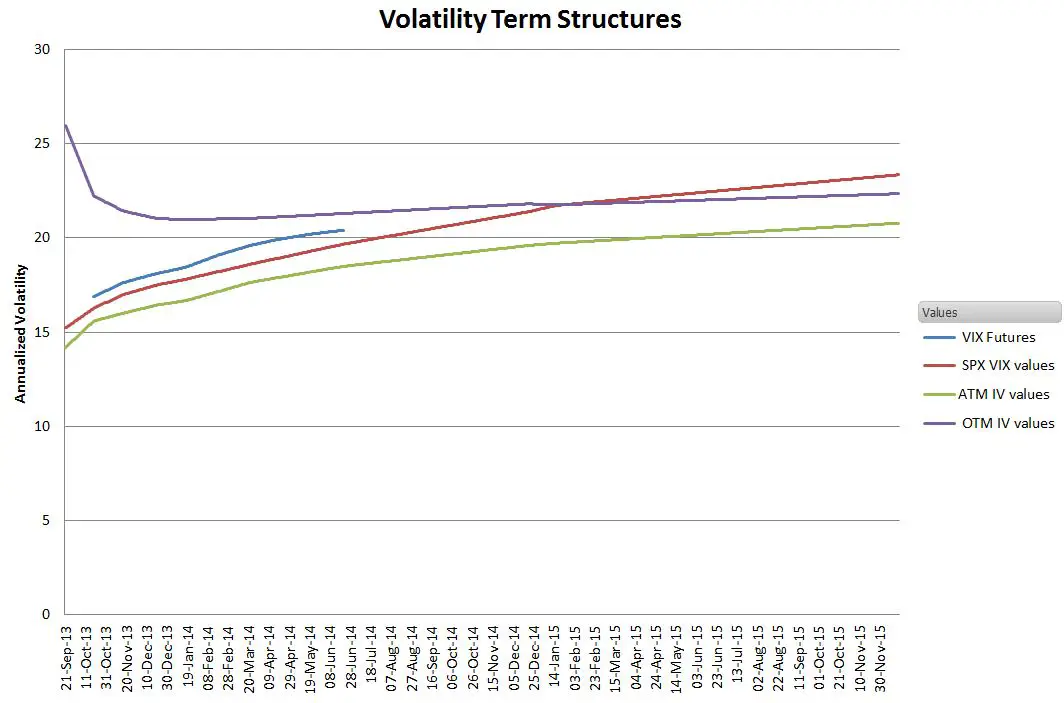
The short term OTM put options show elevated IVs in the short term—prices presumably driven up by buyers of short term insurance. The ATM put options, SPX VIX values and VIX Futures are layered on top of each other as expected however I was surprised that the SPX VIX value climbed above OTM IVs in 2015. A little investigation revealed a significant of activity and open interest in deep OTM Dec 2015 puts—with IVs as high as 65 driving the VIX calculation higher.
Some people think the existing volatility structures are ominous, others feel they are unrealistic and likely temporary, but the data suggests that the structure is driven by investors voting with their portfolios to assert that the world is riskier than Black and Scholes believed.
Click here to leave a comment