Serious volatility watchers are always observing a three-ring circus. The left ring holds the general market. Center ring has options on the S&P 500 and the various CBOE VIX® style indexes and to the right are VIX futures, Volatility Exchange Traded Products like VXX, UVXY, TVIX, and XIV plus associated options.
Activities in the three rings usually follow a familiar choreographed pattern. The VIX moves in opposition to the market while VIX futures and their kin trail the VIX unenthusiastically. VIX futures converge to the VIX’s value at expiration but prior to that they following their own path—usually charging a premium to the VIX, but sometimes offering steep discounts. Meanwhile, in the background, the VIX maintains its reversion to mean behavior, a macro cycle the short term moves modulate.
One of my ongoing interests is monitoring the Volatility Circus’ rings two and three—the family ensembles of VIX and VIX Futures. I note unusual movements and try to determine which one of them is “right” more often—perhaps foreshadowing market moves. Recently I’ve developed a model that helps describe this relationship. It is presented later in this post.
Interpreting the values of VIX futures has been especially challenging. The price relationship of the next to expire VIX future and the VIX tends to be very dynamic in the last few weeks before its expiration. With only a single data point, the one active future with less a month to expiration, there hasn’t been much data to work with.
Of course, there are mind-bending mathematical models available for VIX Future pricing—but unless you have a Ph.D. in quantitative finance they are probably too complex to be helpful.
Enter the CBOE’s Weekly Futures
By introducing VIX futures with weekly expiration dates the CBOE boosted the number of close-in data points from one to five—a dramatic improvement. One day while looking at Eli Mintz’s vixcental.com chart on these new futures a light bulb lit up in my head
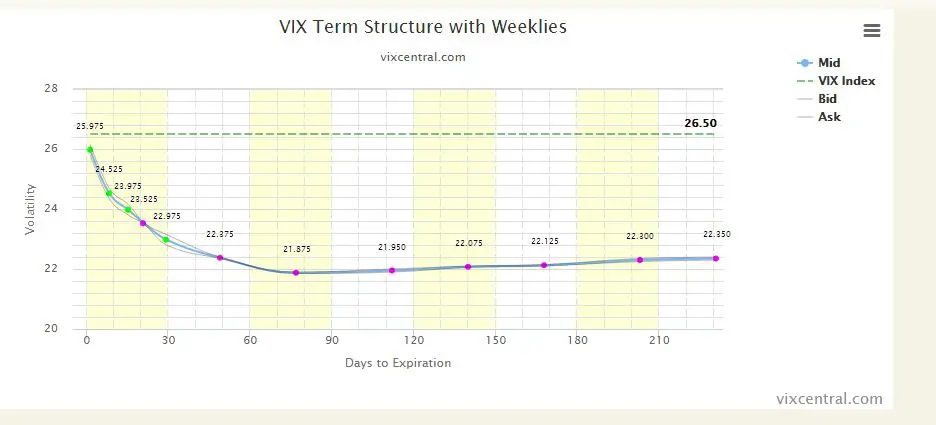
The green dots are the newly introduced futures. Taken together the leftmost part of this curve looked logarithmic to me.
Sure enough, when plotted in Excel the logarithmic trendline match to the first two months of the futures was very good.
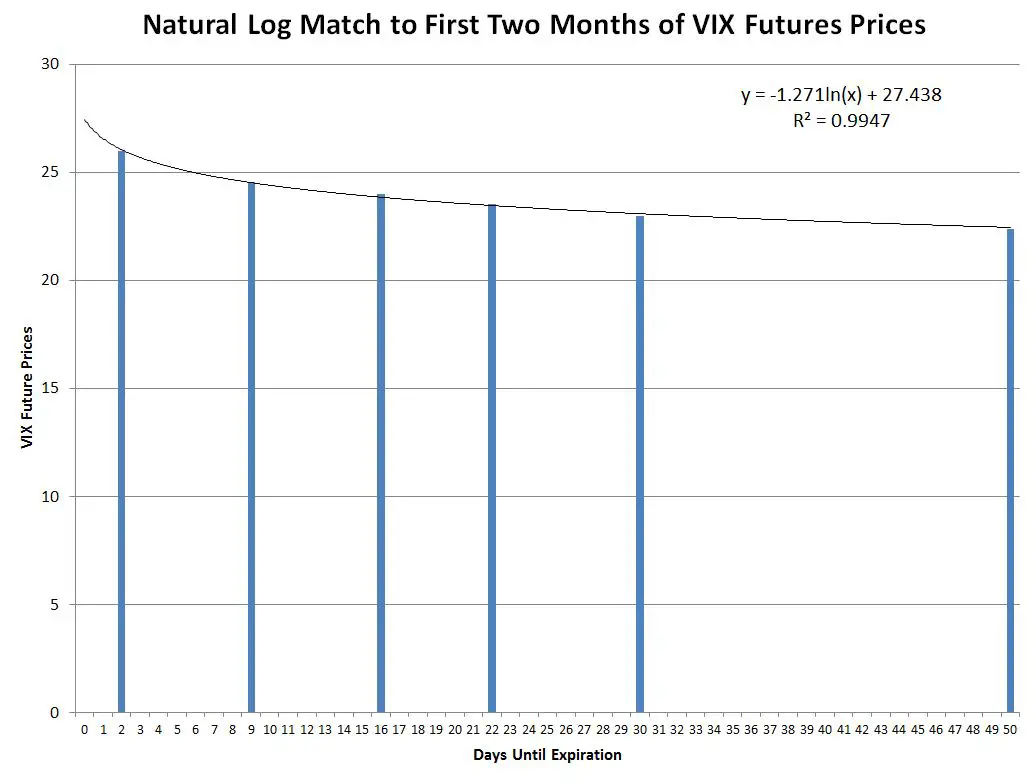
However around month 4 the trendline starts seriously understating VIX futures prices.
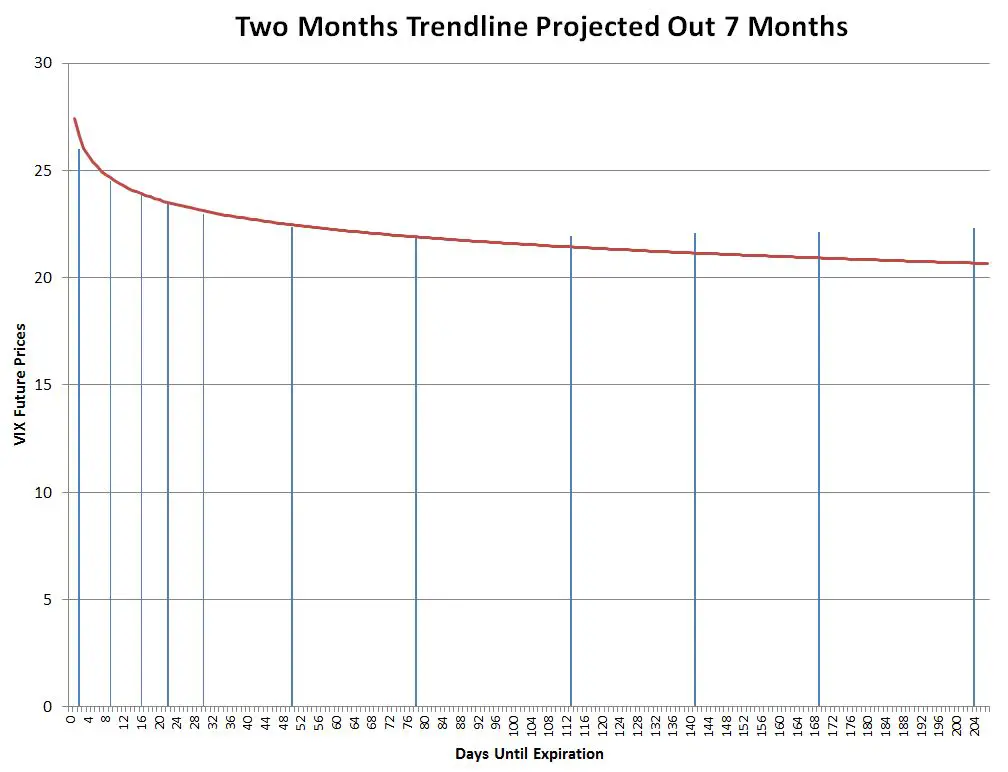
Apparently there’s an additional mechanism that boosts the futures’ value over time.
The Model
Using VIX Futures data from 2004 on I developed the following equation which does a surprisingly good job of estimating VIX futures’ prices given its simplicity. The only inputs are the current VIX value, the number of days (X) until the future expires, and the historical median value of the VIX.
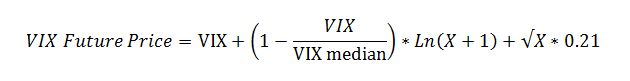
The VIX closing median value from January 1990 through October 2015 is 18.01.
Example calculation: if the VIX is at 16 and a VIX future has 10 days before expiration this model predicts a price of 16.93.
16+ (1-16/18.01)* Ln (10+1) +3.1623*0.23 = 16+ 0.1116* 2.3979 + 3.1623*.21 = 16.93
A near real-time chart of the VIX Futures values predicted by the equation is posted here.
A Few Notes on the Equation
- At VIX Future expiration (X = 0), the equation sets the VIX futures price equal to the VIX. The convergence term in the middle is forced to zero because Ln (0+1) equals zero and the carry cost term on the right is forced to zero by X being zero.
- If the VIX matches its historical median price the convergence term is canceled out by the expression in front of the natural log, and the only difference in prices from the VIX will be the square root of time scaled factor on the right.
- If the VIX is relatively low (below the historic median) the equation predicts the typical premium prices of the VIX futures relative to the VIX. The market is in this state 75% to 85% of the time.
- Conversely, if the VIX is high, the equation predicts the VIX futures will be cheap relative to the VIX levels.
- Since volatility increases with the square root of time, the term on the right side of the equation suggests a time scaled volatility component. The 0.21 factor was determined empirically by adjusting its value until the average errors for the 3rd, 4th, and 5th-month futures from March 2004 through September 2015 were less than a percent. The resulting 0.21 factor is quite close to the historical VIX median volatility of 0.18, so it’s possible that it is an implied volatility factor that rests a few percentage points above the historical value.
Why A Model?
You might reasonably ask why bother with a model when you can just look up the current VIX futures prices on the web. This model is interesting to me because:
- It helps me understand the underlying mechanisms behind VIX Futures pricing
- I can determine how current VIX futures prices are behaving compared to their predicted behavior—useful for evaluating situations where event risk is distorting prices or the market is especially panicky
- I can predict future VIX futures prices for various VIX scenarios
Model Errors
The model is very inaccurate at times, with errors on historic data sometimes exceeding +30%/-15% percent. The chart below shows the model’s error terms for the next to expire futures since 2004.
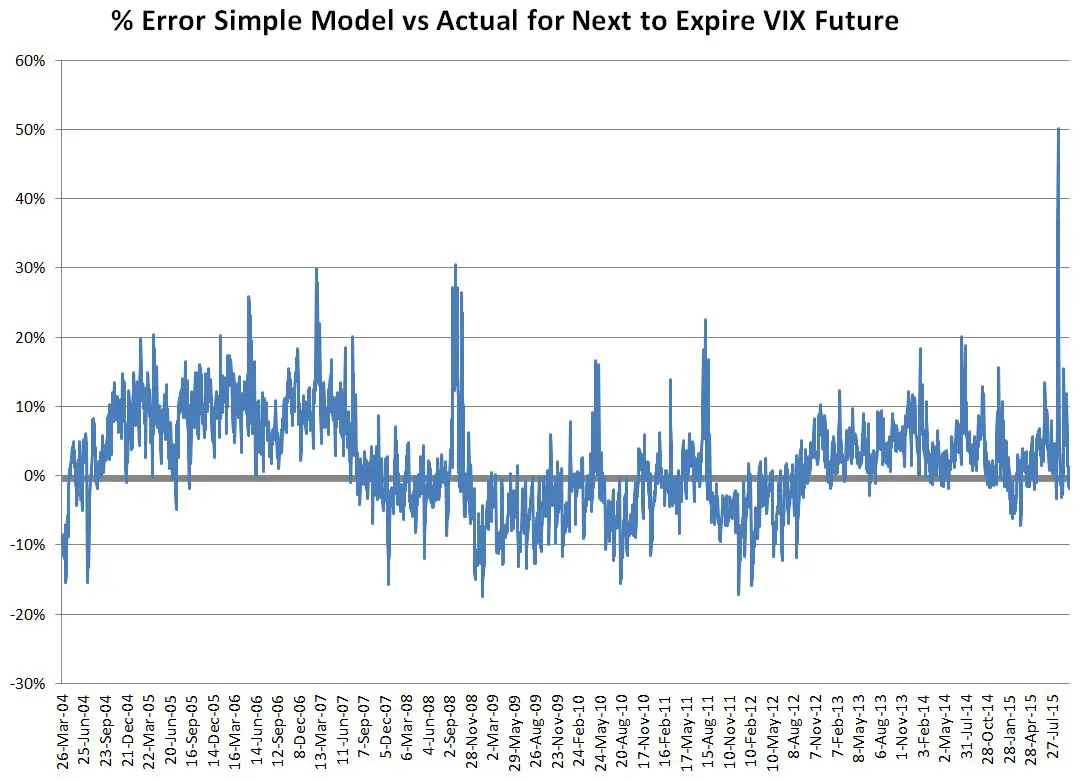
The model tends to overestimate futures prices while in sustained periods of low VIX and underestimate the prices in bear markets. During big volatility spikes (Oct 08, Aug 11, Aug 15) the model predicts VIX futures values that far exceed the actual prices.
It isn’t surprising that the model doesn’t adroitly handle the impact of big jumps or drops in market volatility since it doesn’t incorporate any historical information at all—other than the long-term median VIX value.
The error spike on the far right of the error chart is a whopper, nearly 50%. On August 24th, 2015 the VIX closed up 45% at 40.74, but the front month future (September) only climbed 26% to 25.13. The model predicted a value of 37.16, up 39%.
Despite the chaos prevalent on August 24th the futures market did an impressive job of predicting the eventual (23 days later) expiration value of the September 2015 futures. Expiration was at 22.38, only 2.75 points away from the August 24th closing value.
A more accurate model would need to incorporate the effects of VIX jumps and slumps. It’s not a trivial problem. In general, the VIX futures seriously lag big jumps in the VIX, but then stay higher than you’d expect after the volatility drops. Part of this post is an enhancement to the model that does take VIX’s gyrations into account, but it still leaves a lot to be desired.
Now instead of resembling Fellini’s circus the VIX futures moves in the Volatility Circus feel more rational to me. Their movements are often mysterious and complex—but a simple theme unites.
Is it possible that vix futures pricing is determined by the market makers? So essentially quantity of supply and demand for the contracts per minute? If for instance the front month is 15 days to expiration and a hedge fund puts a huge order in to buy the front month contract would this not change the price at least for the intraday pricing for that tick for instance?
Hi Temil, My understanding (from an informal conversation with a CBOE employee) is that VIX futures do not have designated or lead market makers. She indicated that there were enough active participants in the VIX futures market that market makers were not needed. My guess is that participants in that market have very sophisticated models of VIX Pricing, and the ability to hedge their positions in many ways, including the underlying SPX options. Sure if a very large order comes in it will move the market, but I think having a real time estimate (via sophisticated algorithms) of the VIX Futures’ values is probably the backbone of the business.
Can your models tracking error be due to changes in your median value over different changing time frame and environments ?
My models were developed by curve fitting historical data. What I’m seeing is that the equations are pretty good at fitting the shape of the curve, but not very good at mapping to the current absolute, or lagged value of the VIX. If I use a value for the VIX that’s somewhat higher than the current value I can get a very good match to the price points of the longer term contracts (e.g, 2 to 3 months) out and further. The VIX futures have been in heavy contango most of this year and the offset in my equations between the VIX / lagged VIX and the futures values supports that. As to what that means, I don’t know. It might just reflect high demand for long positions (although the retail short interest is at high levels on VIX futures). It could just be characteristic of our current S&P market conditions where new all time highs have to climb a “wall of worry”. People are understandably concerned about corrections, etc, so may be bidding up the long vol side of things. Obviously all just speculation right now. I will predict that the gap won’t get much higher–much more of a gap then arbitrage with SPX options will become attractive.
— Vance
Great article! I love the circus analogy. I was playing around with the numbers to see if there might be some predictive power for future ETP returns based on end of day variance from the model, and what I see looks promising. Instead of the long term VIX median, I used a short-term median (rolling 20 day) and I like what I see. Thanks!
Hi David, The model does seem to highlight discrepancies that then resolve themselves. I also played around quite a bit using a shorter term median–it does reduce the errors, but I decided to start with the simpler model. I’ve been focused on handling the shorter term VIX jumps and slumps better. An exponential moving average on VIX with a coefficient of .5 shows some promise.
— Vance
I’ve played with Moving Averages also, and have found better luck with with the ETF moving averages than the moving average of the VIX itself. What data set do you use? I used to use “end of day” data (both real and calculated back to 2004…BUT I realized that “end of day” for the VIX and the ETFs is different than “end of day” for the futures, and the difference seems to be pretty significant. So doing calculations using both (like comparing your model to actual futures prices) ends up being flawed. I bought a data set from Kibot that is in half-hourly increments, so I use 3:30 PM for all my calcs. The only problem is that I can now only go back to March 2010.
I use the CBOE’s historic data for futures and the VIX. The CBOE’s VIX close is 4:15PM. I think it matches pretty well with the futures EOD.
–Vance
A more mundane problem to work on: How to hedge the theoretically unlimited risk of selling premium on uvxy that my broker warns me about, without giving up much premium. Price decay of uvxy undeniable over the long term, but unpredictable short term. Rapid and consistent price decay over time of out of money calls, however, only happens in short term. Sell nearby OOM calls and buy far expiry at same strike?
Hi Phil, Tough problem. No free money here. I think further out of the money long calls for the same series is probably the best solution. Reduces your premium considerably, but caps your losses reliably.
I don’t think the calendar approach you suggest will work. If I look at the appropriate options chains the distant expiry options are expensive and have a high delta. Time decay in the underlying would eat you up.
— Vance
Hmmm…the systematic estimation error actually looks like it can form a trading strategy. That is, long VXX the next day on open when you underestimate the futures price, and long XIV the next day on open when you overestimate it. Maybe set some threshold bounds (I.E. flat when it’s within +/- 5%)?
Care to test that out?
Don’t have the energy right now, but I appreciate the thought. I’ll be watching the model relative to the actuals to see how differences get resolved.
— Vance
I was very curious about that and your response was very helpful. Thanks for the blog too, and look forward to chatting more in the future.