While it’s certain that short-term volatility exchange-traded products (ETPs) like VXX, UVIX, and UVXY are doomed to march toward zero, their decay rates are not consistent. Things like bear markets and big corrections can cause big upward swings. On the downside, the term structure of VIX futures and the volatility of volatility can significantly impact decay rates in monthly and yearly time frames.
The charts below give a graphical history of their decay rates. With each of them, I’m making trade-offs between reducing noise (averaging out normal market action) and the ability to see medium-term trends. Each data point on the first chart is computed using the cumulative gain or loss over the previous six months and a monthly compounding period.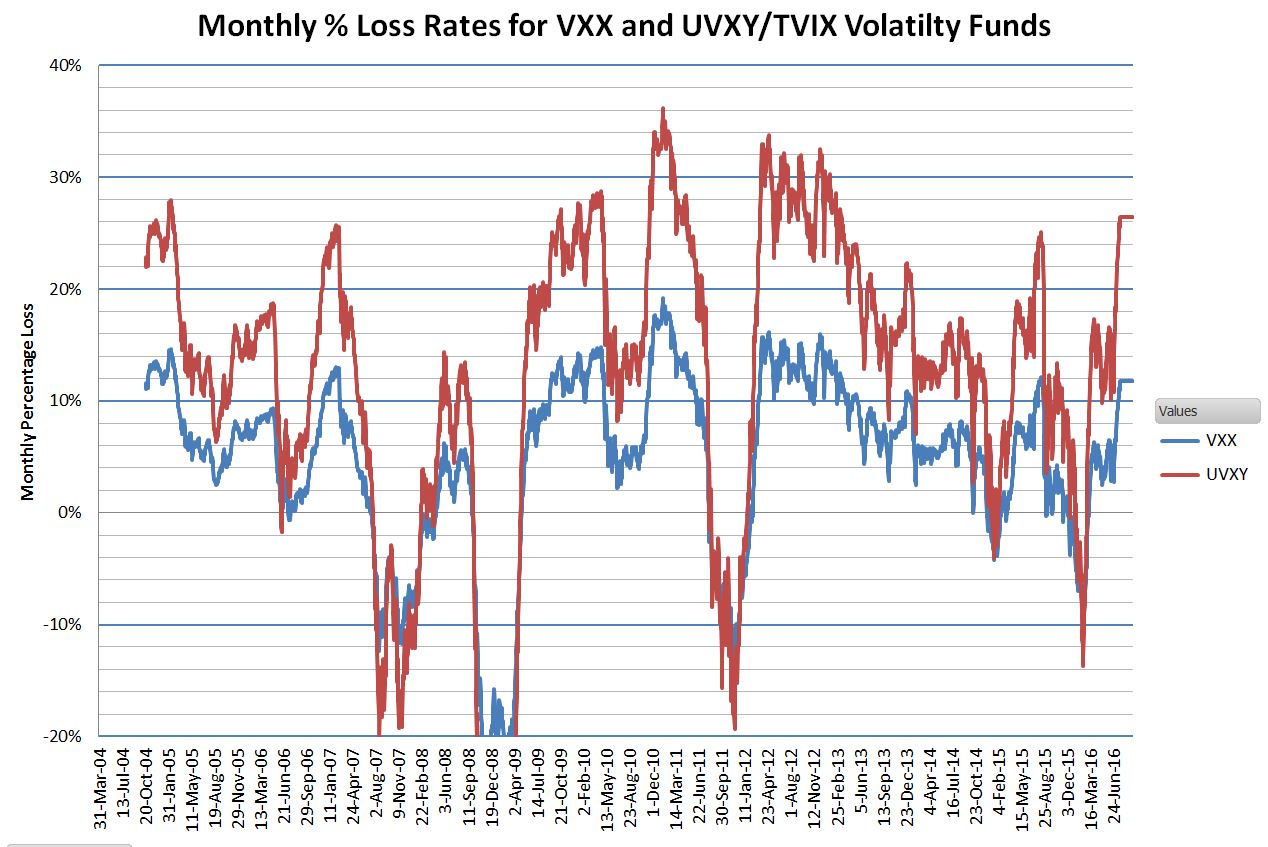
None of these ETPs existed before 2009 (the first one, VXX started in January 2009), so I used my simulations based on historical VIX futures data to generate the pre-inception data.
The yearly percentage chart below uses a monthly moving average for all the price points and then uses the result for each date and the price a year prior to compute the simple percentage increase or decrease.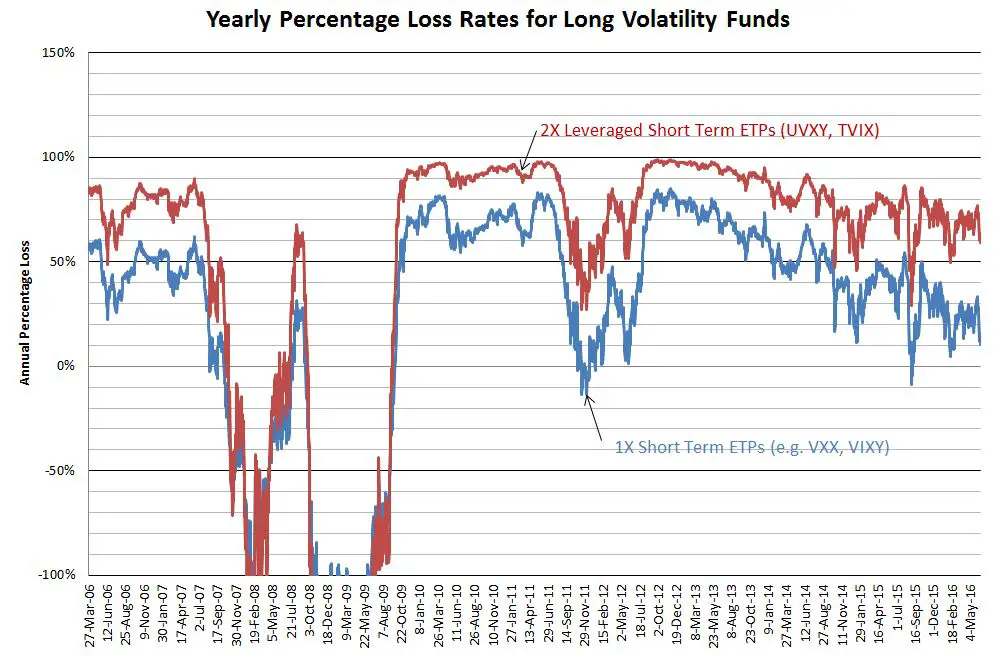
Despite eye-watering decay rates, these funds are increasing in popularity. I’m not sure why (except for the possibility of shorting them).
They are one of the few investments that will reliably go up when the market has a significant drop, but unless your timing is exquisite the decay rates on these ETPs will make you wish you never laid eyes on them.
Quant Corner
- The formula used in the first chart is the classic compounding equation: Compounded Growth = ((End Price/ Start Price)^(1/Period))-1 To obtain monthly compounded returns I use a start price 6 months prior to the end price. The start price I use is the average of the prices 21 days prior to and including the start date. The period used in the formula is, of course, six. I multiplied the results by negative one in order to make decay rates show up as positive numbers.
- The second chart uses moving average prices (22 trading days) and computes the percentages using End Price / Start Price -1, with the start price one year previous to the end price. I multiplied the results by negative one in order to make decay rates show up as positive numbers.
Thank You Vance
Instead of shorting these funds is there any reason you wouldn’t go long on there opposites. Svxy for example I have read that this fund should only beheld short term but I don’t know why it can’t be held longer. Any help would be greatly appreciated.
Thank You
Hi Greg,
For starters you can read this post on XIV, which is very similar to SVXY: https://www.sixfigureinvesting.com/2014/05/how-does-xiv-work/
The biggest downside is something called volatility drag–which is discussed in the post. It’s certainly reasonable to hold these inverse funds for weeks / months–unlike VXX, TVIX, & UVXY.
Best Regards,
Vance
SVXY is another crappy time eroding wasting ETF for long trades unless the market is very strong. Just look at long term chart. While ES is at new highs SVXY is much lower. Buying puts in SVXY and UVXY at the same time might work over the long term. Buy far out puts – 12 months out and wait. Profits should come from either or both products. Sideways markets may bring profits in both. Buying SVXY puts is mostly a hedge against strong upmove in short term for UVXY (and short term loss of put value)
Thank You for your help Stuart as I’m new to investing I don’t know what ES stands for. I looked at the chart for SVXY since its inception and compared it to the S&P and DJI. It out performed both of them so am I missing something? The reason I ask is I’m looking for something to put my savings in and leave it for the next 10-15 years. I will research your theory of buying puts in both funds.
Thank You.
ES is emini SP 500 futures contracts which are very heavily traded. Well on SVXY look at a weekly chart compared to SPY OR SPXL (BASICALLY LEVERAGED SPY) you will see SVXY has risen recently but is way off the highs. When the market tanks SVXY tanks more. SPY is close to all time highs. SVXY is not good for long term trades of months and years. Just look at weekly charts. Not clear why you would say SVXY outperforms when on weekly it clearly doesn’t. It may be up more over the last few weeks in an up market but that proves nothing for long term trading. For long term trading I would not use leveraged funds as you will lose a lot in down markets. Investigate selling option calls as income against your long positions for extra profit and protection against losses. Say you buy 200 shares of MSFT for $11,000 you sell 2 Sep 57.50 calls against it. You get $200. If MSFT trades sideways or down you keep the $200 at expiration; if it goes up you just close the calls before expiration and then sell another later call further out. Keep doing this every month and say you just do this 6 times a year you have made an extra $1200. So you made 10% on a boring stock moving sideways. Compounding is huge over time.
Thanks Stuart
When I go on yahoo finance interactive charts and compare svxy to spy over 5 years svxy has a return of 500% compared to spy which has a return of 85% and spxl has a return of 439% that’s how I came up with svxy out performing spy. When I compare the 2 or 1 year chart then it svxy underperforms both funds. From looking at the chart I think spxl is the better fund as it doesn’t lose as much in a down market. I also like your idea about selling covered calls I think I’m going to try that. Do you think it is better to sell monthly , weekly or bi-weekly calls
Greg,
OK Good point as it seems that 2012-2014 SVXY did very well when the stock market was soaring. However with greater volatility as in last 18 months it does not do as well even when the market is ultimately on its highs. SPY is safer in sideways markets. Remember you will lose in a sideways market with SVXY whereas SPY or SPXL will be flat. So again while SVXY will do really well in a strong bull market it is riskier. Maybe put some money in it if you are very bullish but I would NOT expect that 500% every 5 years. SPXL is better for leveraging long I think. I own some SPXL and also sell calls against it.
I sell options 4-6 weeks out to get more premium
The decay rate of VXX seems be lessening over time. Is that just due to the specific market conditions we have seen last 2-3 years, or is being managed somehow more efficiently?
There’s nothing new on the efficiency front. Contango has definitely lessened the last couple of years. Might just be supply and demand, a lot of people are short volatility, trying to capitalize on the decay.
Excellent study, Vance. Why do you think the decay rate of both VXX and UVXY has decreased in the last 2-3 years from its high reached in Nov. 2013? Was Contango strongest back then (i.e., generally low vol)? Was there more chop?
Thank you, Vance. See these numbers makes you think that there must be a way to be short VXX, UVXY, etc. as a default and to go long these instruments during periods of market despair. The problem, of course, is when to go long and when to reverse back to a short position. Do you have any ideas?
Hi Alex, A lot of brain power has been spent on this subject. It’s a tough problem. One thing for sure, greed will get you killed in this game. I suggest you check out my blog roll, A lot of expertise there.
i have been shorting UVXY for about 18 months. How to do this. Don’t overleverage!! Buy out of the money puts. Only buy them when the market is tanking and UVXY is up. What will go up will come down And in the case of UVXY it will ALWAYS GO BACK DOWN. So when UVXY is up the puts are cheaper. You have to be willing to hold the ups and downs of the market. Buy puts than are 1-2 years out. I have some Jan 17 with strike of 30 puts. I am up 50% from when I bought a year ago. Since the put value will go down if the market tanks as I said you have to be able to ride. The put value does NOT go up and down so much when you are buying puts out so far though. I am expecting these puts to be worth more by Jan 2017 than they are now. When I see the opportunity I am going to buy Jan 2018 puts. I think it is very dangerous to buy UVXY. You might get lucky but the timing has to be very good. Timing is NOT so important for the long term puts but it will take longer for a pay out. Hey if I can make 50% a year on this investment I am more than happy.
That’s great but I think you need to look at the price of the implied volatility on those puts you are purchasing when uvxy is going vertical.
That may be true. It may be difficult to time perfectly. However if UVXY doubles in price it always comes down. True it may more than double in price and you would be losing for a little while if you are not buying puts at the top of the market. However buying at least 12 months out chart patterns show that UVXY drops by about 80% per year (yes it varies). Put prices are typically not completely taking this large a drop into account.
“The CBOE Volatility Index (VIX) sonar video seems to have disappeared into the ether. But here’s the deal — about the same time as the VXX fireworks, a player bought 120,000 January 2017 9-strike puts in ProShares Trust Ultra VIX Short Term Futures ETF (UVXY) for $5.10” $61 million trade This was around Mar 23, 2015. You can Google it and find it. There has been a 5-1 reverse split since then so translated pricing would be buying 45 puts when UVXY was trading at 75. That put is trading now at 39. So do the math 39/5 = 7.8. So the $5.10 price is now effectively trading at $7.8 almost exactly increasing by 50%. Some of this time the trade was losing by millions of dollars so as I said you have to be able to hold through turmoil. Nevertheless it’s now worth around $90 million. UVXY is reverse splitting again this month 5:1. So at value now of about 6 it will be repriced to 30, give or take. And with some volatility while continue grinding back down to about a price of 6 again in 12- 18 months when it will do another reverse split. You can Google all its reverse splits dates in the past. In 2011 it was trading at an effective price of $300,000 and now it is at $6. Is there a pattern here? .
“They are one of the few investments that will reliably go up when the market has a significant drop, but unless your timing is exquisite the decay rates on these ETPs will make you wish you never laid eyes on them.” – could not agree more! Thanks for putting this together, Vance.