I am offering a Volatility ETP Projection Service that calculates future volatility Exchange Traded Product (ETP) prices assuming the current VIX futures term structure is stable.
In my post Using the VIX Futures Term Structure to Predict Volatility ETP Prices, I show how this approach can be used to produce statistically valid ETP price projections and ranges.
This forecast does not attempt to predict upcoming volatility spikes or slumps—it’s totally focused on the price trends that would occur with a static VIX futures term structure.
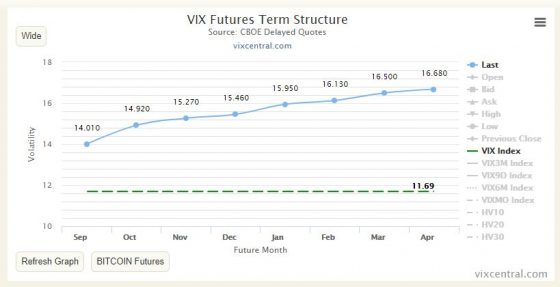
With a stable term structure (and a stable spot VIX), the VIX futures prices that underlie the volatility ETPs like VXX, VXXB, UVXY, and SVXY do change but they precisely follow the price/days-til-expiration curve. The VIX Central chart below shows the closing VIX futures prices for August 23, 2018. If the term structure is stable then the curve at the end of the 24th would have the identical price vs time shape but the blue data points, representing futures values, would all be shifted slightly down and to the left.
The VIX futures that underlie the volatility ETP are volatile creatures—tomorrow’s values can be dramatically different than today. I’m not trying to predict those sorts of changes. What I am computing is the decay or boost that the volatility ETPs experience if the term structure stays in a stable contango or backwardation configuration. This calculation is not an easy problem—there are a lot of moving parts even when the market is stable.
Historically the VIX futures term structure has been in a contango configuration 80%+ of the time. Contango fuels a situation where the long volatility ETPs like VXX, UVXY, or TVIX suffer from high decay factors. Anyone that’s looked at their long-term charts will see the massive impact of those decays over the long run.
Because of the typical decay in long volatility products, short volatility trades are popular but the possibility of volatility spikes makes risk management an important concern. By estimating median prices and +-1 sigma ranges traders have some analytical results that can help quantify payoffs and establish appropriate risk management thresholds.
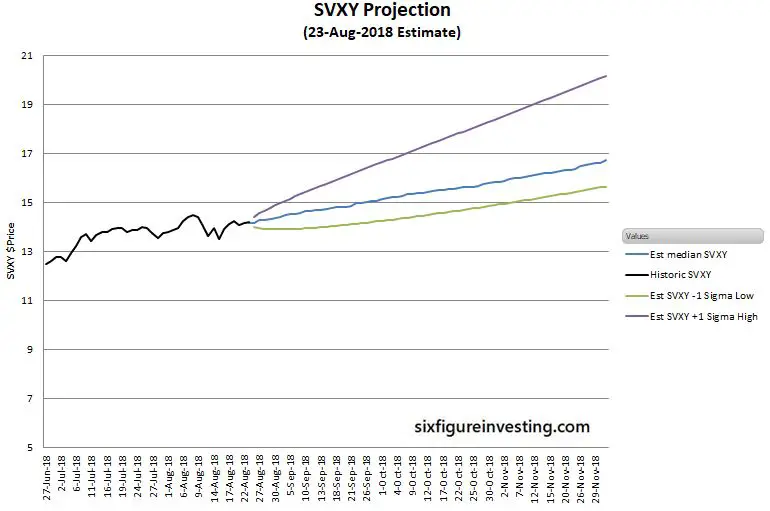
The chart below shows a typical SVXY projection when the term structure has been in contango for a while.
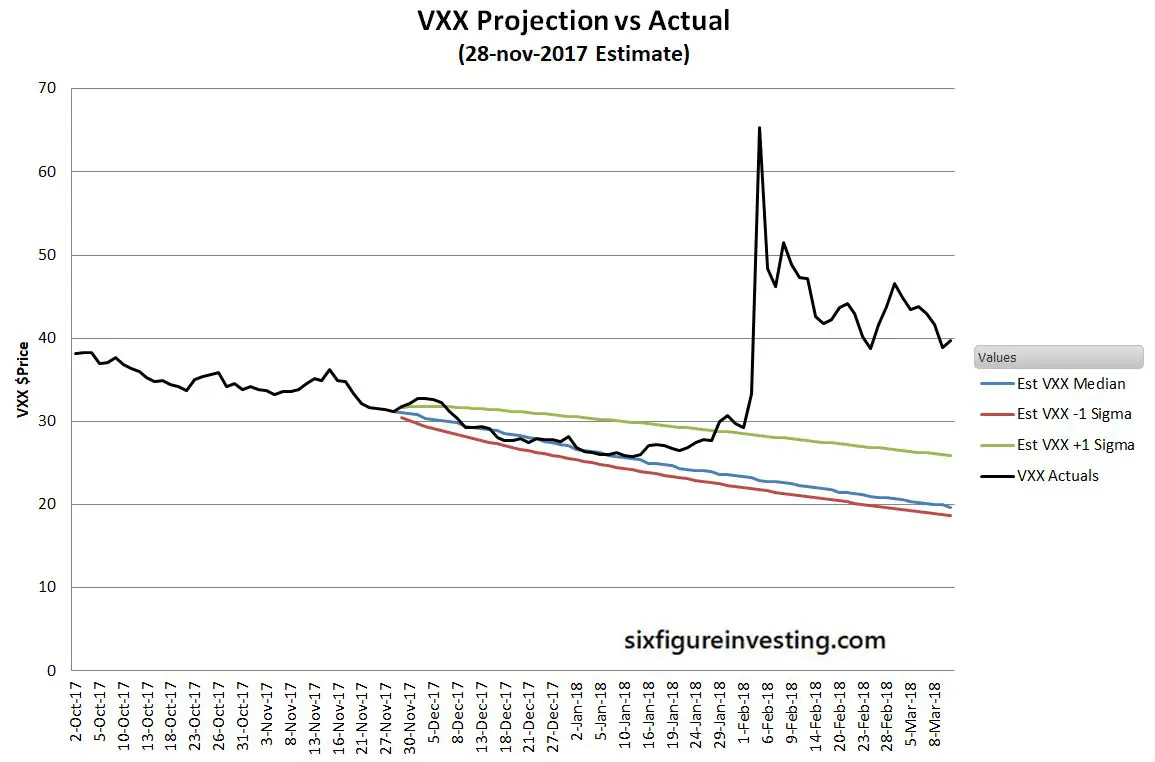
The next chart shows what the VXX projection would have looked like on November 28, 2017, compared to the actual path of VXX after that.
The chart below shows histograms of percent differences between the actual results and 21 trading day median forecasts for May 2004 through January 2018.
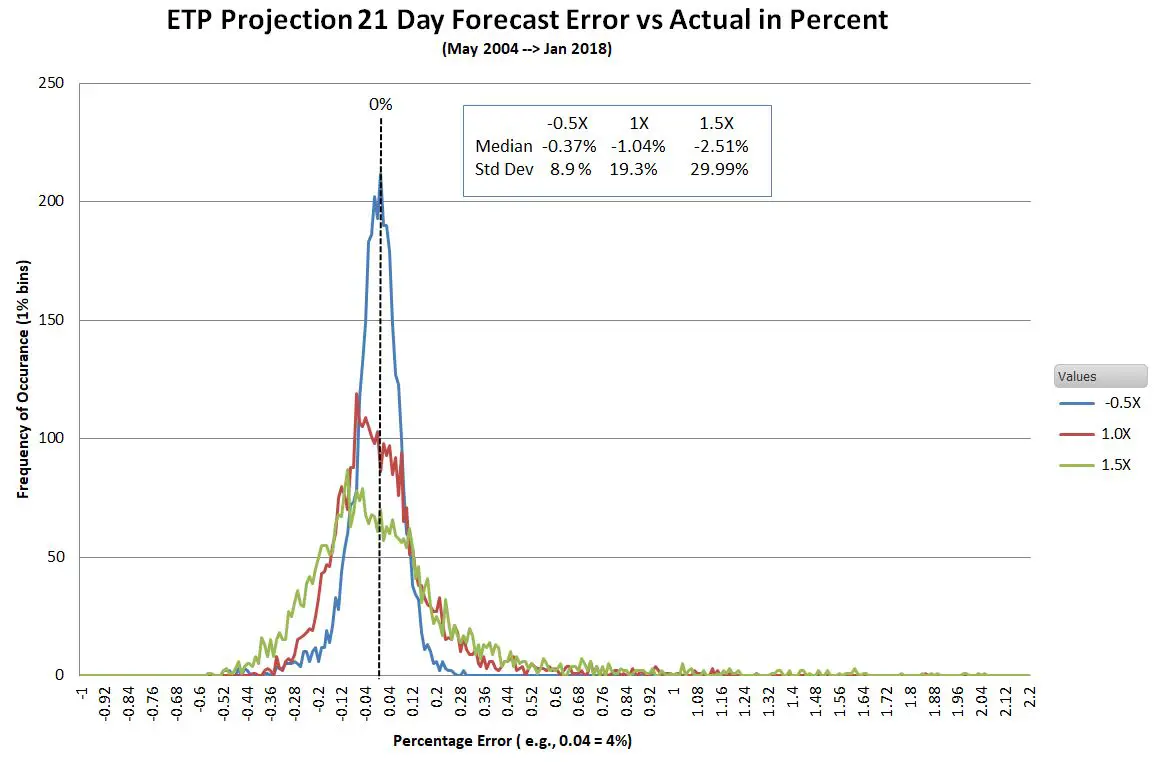
The median error is within a few percent for all the ETPs. The relatively wide error distributions, especially on the high side for the long volatility funds, reflects the impact of volatility slumps and spikes. For more on the statistical characteristics of these projections please see Using the VIX Futures Term Structure to Predict Volatility ETP Prices.
The Product
- The product is an online spreadsheet delivered via Google’s free web-based office suite.
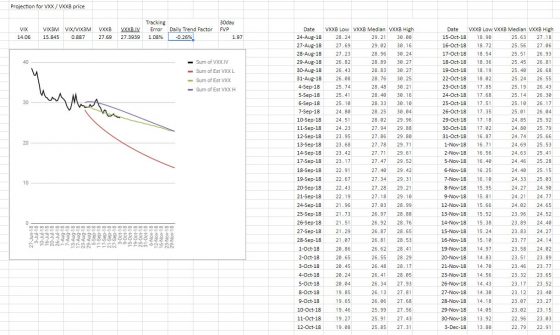
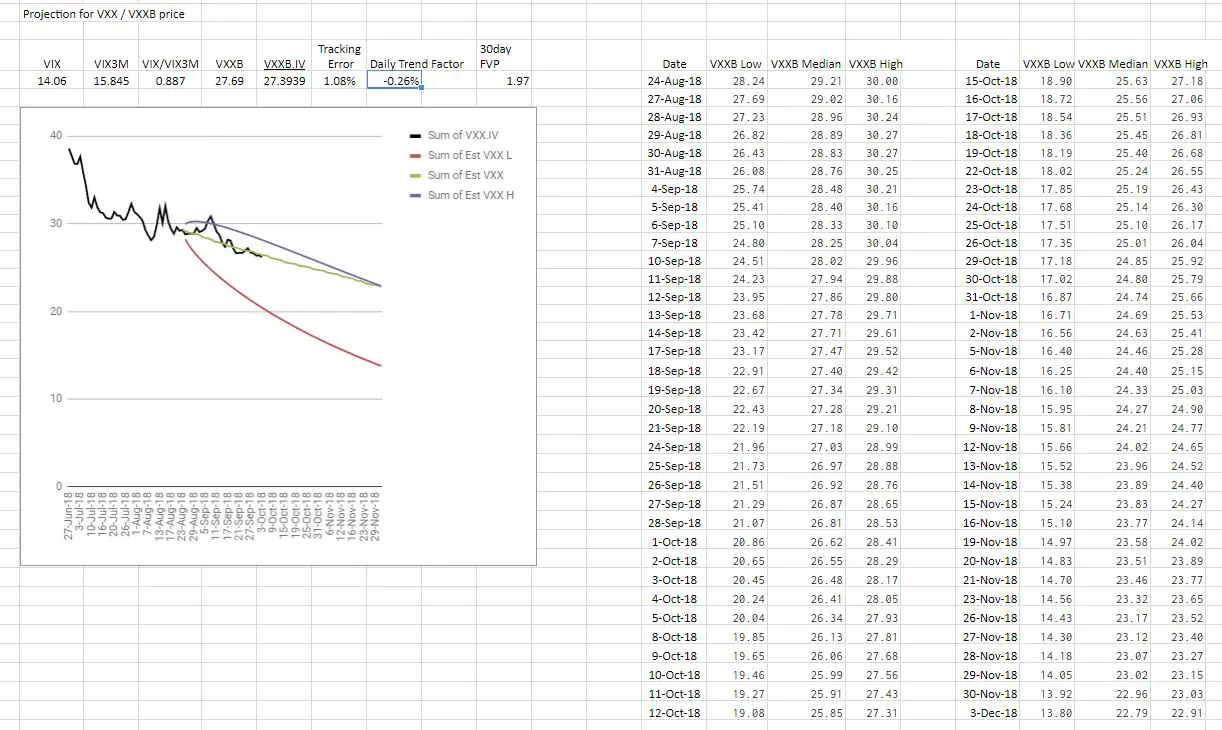
- In addition to charts, the service also provides projected high, low, and median prices for the next 70 trading days. The screenshot below provides an example
- This link is a read-only version of the spreadsheet showing the projection using 10-Oct-2017 as the starting date.
- None of the important formulas used to compute the projections will be visible; the information in the spreadsheet is essentially values only.
- Currently, SVXY, VXX, and UVXY tickers are available. Please let me know if you are interested in other tickers.
Key Specifications
- Median Price Projections
- Projected median prices for the next 70 trading days based on recent VIX and VIX futures prices (quotes are delayed 20 minutes or more). If the market is closed the most recent regular market closing prices are used. You should expect the actual prices to end up above or below that projected value at about the same 50% rate.
- For example, if the median SVXY projection for 21 trading days from now is $15/share then statistically you should expect the actual SVXY value when that day arrives to be a coin flip, 50% of the time above and 50% below.
- Historically the standard deviation of percentage errors between the ETP projection value and the actual 21 trading day value has been 8.9%, so statistically, you should expect the forecast value error to be +-8.9% or more 32% of the time.
- One Sigma High/Low Range Projections
- Projected high/low one sigma price ranges for the next 70 trading days are based on the last 40 days of historic prices for the respective ETPs.
- Theoretically, you can expect the actual prices to close below the high range around 84% of the time and below the low range around 16% of the time.
- For example, if the realized volatility of SVXY for the last 40 days has been running at a 24% annualized rate and the current value of SVXY is $15 statistically you should expect the actual SVXY value 21 trading days after the estimate to be above $16.07 or below $14 around 32% of the time.
Disclaimers
- This service does NOT predict the future! It only projects what the ETP prices would do given current spot VIX, VIX futures prices, and a static VIX futures term structure. It is a very safe assumption that these factors will NOT stay static.
- This spreadsheet does not attempt to predict volatility spikes or slumps—it’s only concerned with computing the impact of a stable VIX futures term structure on volatility ETP prices. Oftentimes volatility spikes & slumps will move prices well away from the projections.
- The input information I use (e.g., VIX, VIX futures prices) is delayed by an indeterminate amount of time (usually at least 20 minutes) and may be inaccurate or nonsensical—especially during times of market stress. Obviously, if the input information is wrong my projections will be useless.
- High/low range projections are based on historic ETP volatility and growth/decline factors, they do not incorporate information from the VIX futures term structure
How To Subscribe
- On the form at the bottom of this post select the ticker(s) you are interested in and then click the “Subscribe” button. You will be taken to the PayPal site to complete the process.
- If you have additional users you want to be added to the subscription email me at [email protected] with their email addresses. Unless I hear otherwise I will assume that the email used for the PayPal subscription will be the email for the default user. The user emails can be changed by sending me an email with the updated information.
- The single ticker subscription price is $25/ month for up to 3 unique users, currently, I offer SVXY, VXX, and UVXY.
- A combined three ticker subscription (SVXY, VXX, UVXY) is available for $39/month, for up to 3 unique users.
- Contact me at [email protected] if you require more users.
- If you subscribe, a custom link similar to the one below will be sent to the email address(s) you provide. The link enables access to your shared spreadsheet https://docs.google.com/spreadsheets/d/1M5zD62LiE382eJhlJz6QYRyh9Q5bPU2z90M9XP2OHhM/edit?usp=sharing_eip&ts=5b7e4255
System Requirements
- You must have internet access to view/edit the spreadsheet. If you have a Google account you can download the spreadsheet information in various formats (e.g., xlsx, pdf, ods) to your computer so that you can save the spreadsheet off-line but they will not update while in those formats.
- Individual sheets in the spreadsheet with names starting with “RSV-” are reserved and can’t be edited by subscribers—I reserve the right to over-write them at any time in order to correct problems or add additional functionality. You do not need a pre-existing Google account to view the product, however, if you want to have edit capabilities, for example, to add sheets then you need to have a Google account. If you have edit capabilities you can reference cells in the reserved sheets. Your additions are visible to me so you should not include proprietary information on the spreadsheet.
Cancellation policy
- You can cancel the service via PayPal at any time (details in this ReadMe file), however I will not refund any money if you cancel within the first month of subscription. Your spreadsheet will stay active through that first month regardless of when you cancel. I receive a notification from PayPal if you cancel but it can’t hurt to notify me directly at [email protected]. After the first month I will refund via PayPal the prorated time remaining in your subscription. For example, if you are 20 days into the 30-day billing cycle you would be refunded 33% of the payment.
- If you cancel your subscription I will revoke permission for you to access the spreadsheet once your paid-for time has elapsed. At any time before cancelation, you can copy the spreadsheet. The copied spreadsheet will not update but you can preserve any extensions you’ve added to the spreadsheet.
Click here to leave a comment
1 thought on “Volatility ETP Price Projection Service”