This post discusses how the LONGVOL and SHORTVOL indexes work, but starts with some historical background that illuminates why these new indexes were needed.
Two new leveraged volatility Exchange Traded Funds from Volatility Shares, -1X SVIX and 2X UVIX started trading on the 30th of March, 2022. SVIX and UVIX utilize two new Cboe indexes, the Short VIX Futures Index (ticker: SHORTVOL) and the Long VIX Futures Index (ticker: LONGVOL) respectively as their tracking indexes. From this point on I will refer to these indexes by their tickers, not their formal names. More information on SVIX & UVIX is available in their prospectus and these two blog posts (SVIX, UVIX).
Before we get into the specifics of how LONGVOL and SHORTVOL work, I’m disclosing that I hold a small, minority share in Volatility Shares LLC, the issuer of the BITX, ETHU, SVIX, UVIX, and ZIVB ETFs. I do not hold management, executive, or operational roles in Volatility Shares LLC, nor do I give recommendations or investment advice to their clients. My analysis of these funds and their associated indexes is my own, is not investment advice, and is based on publicly-available information.
All passive Exchange Traded Funds (ETFs) and Exchange Traded Notes (ETNs) reference indexes that provide investors with a blueprint for how the funds will invest assets, as well as a benchmark for measuring how well these funds are achieving their stated objectives. For Exchange Traded Notes, the day-end value of the underlying index is a key operational parameter; it’s the price at which the issuer will redeem or create shares. For the more common Exchange Traded Funds, its associated index is a performance target, but not something the fund commits to operationally.
The Beginnings of ETF-based Volatility Trading
VXX, the first short term volatility-based fund was introduced by Barclays In January 2009. VXX is an Exchange Traded Note so the design of its underlying index (SPVXSTR) was critical to the success of the fund. If actual trading/hedging based on SPVXSTR could not have been economically accomplished then VXX would have failed. However, the index worked well and VXX became very successful, gathering over a billion dollars in assets under management. Competitors that followed used the closely related SPVXSP index, which uses the same algorithms as SPVXSTR except that Treasury bill interest is not included.
VIX futures contracts have fixed expiration dates, so maintaining a long volatility exposure requires both the periodic selling of contracts from futures that are approaching expiration and buying contracts with more time remaining. To minimize market disruption and maintain relatively consistent exposure to volatility the SPVXSTR index specifies a different mix of first- and second-month VIX futures at the end of each trading day, so on average around 5% of the value of the fund is shifted, or “rolled,” each day. The “first-month” futures are the soonest to expire, and are often labeled “m1”, and the “second-month” futures (which have approximately 30 more days until their expiration) are often labeled “m2” futures.
Trading at the Last Minute
Unfortunately, the SPVXSTR/SPVXSP index calculations assume that the specified end-of-day VIX future sales/purchases are executed at their end-of-day settlement prices. When VXX first started it was impossible to consistently trade each future’s settlement price because the settlement price, which often differs from the last trade price, is not formalized until after the market closes. While the settlement price is usually within a tenth of a point of the closing price, it can differ by as much as a percent or two. The CFE futures exchange, the venue where VIX futures are traded, uses a formal process for determining the end-of-day settlement prices. This greatly reduces the risk of final, end-of-day price anomalies due to corrupted trade data, market anomalies, or end-of-day market manipulation attempts.
Without the ability to trade at the settlement price, asset managers usually tried to trade very close to the end of the day to minimize their tracking errors, but even if they managed to be the last trade of the day the actual settlement price was out of their control. Needless to say, asset managers didn’t like this uncertainty.
Enter Trade At Settlement (TAS)
The Cboe enabled ETF and ETN asset managers to actually trade at the settlement time by adding a new order type, and associated order book, on November 4th, 2011. The Trade at Settlement (TAS) order allows organizations to place intra-day orders, that if filled, guarantee a purchase or sale of the desired futures contracts at, or near, the end-of-day settlement price. The TAS order includes a price offset, commonly called the “spread,” specified in points, that can be used to make the trade more attractive to the counterparty. On typical days, this offset ranges between -0.01 and +0.01 points. When first created, the TAS order offset was limited to a maximum of +-0.1 points. Each point on a VIX future is worth $1000.
The TAS order met the needs of organizations trying to track the volatility indexes and typically constitutes about 10% of the daily volume in VIX futures. Unfortunately, it further concentrates VIX futures trading volume at the end of regular hours trading. For more information see Trading at Settlement (TAS) in VIX futures.
Enter Leveraged Funds
Following the success of VXX, ProShares, and VelocityShares introduced -1X and 2X leveraged funds (SVXY, UVXY, XIV, TVIX) based on the SPVXSP index. These leveraged, daily resetting funds attempt to match the daily percentage moves of the index multiplied by the leverage factor. So, for example, VelocityShares’ XIV -1X fund would short futures such that the fund’s value would move up 10% if SPVXSP moved down 10% in a day. The rebalancing algorithms required by these leveraged funds have the unfortunate characteristic that both the inverse and long funds need to rebalance their assets in the same direction at day end. If volatility jumps during the day, the long funds need to buy futures to increase their leverage and inverse funds also need to buy futures because they need to cover some of their short positions. For more on this topic see How do Leveraged ETFs Work?
This rebalancing requirement of leveraged funds is not unique to volatility ETFs & ETNs (collectively known as Exchange Trade Products (ETPs)). All daily resetting leveraged ETPs (e.g., ProShares’ SSO 2X S&P 500) need to do end-of-day asset rebalancing.
In markets where ETP holdings are a significant percentage of the underlying market, rebalancing requirements lead to an unhealthy situation. The timing, size, and direction (buy/sell) of the end-of-day rolling/rebalancing trades of the funds is public information, an open invitation to market front-running & liquidity withholding by market participants.
Volmageddon, February 5th, 2018
Price distortions due to ETP rebalancing flows on the underlying securities are not just a theoretical problem. It’s almost certainly the cause of what happened on February 5th, 2018 when a sharp, but not extraordinary four percent drop in the S&P 500 after a period of low volatility triggered a devastating earthquake for the XIV and SVXY inverse leveraged volatility ETPs. With the front month VIX future up 49% at the 4 PM equity market close, it was very likely that at least $800 million in VIX futures needed to be purchased for rolling/rebalancing at the 4:15 PM close of the VIX futures market. Sellers raised prices, knowing that buyers had little choice but to buy. The TAS order process froze up with no sellers willing to participate, even with the maximum 0.1-point sweetener. After the equity market close, buying demand drove up VIX futures prices another 63% in the 15 minutes before the VIX futures close/settlement. SPVXSP ended up +96% for the day, and XIV, constrained to follow the inverse of that index was down 96%, wiping out hundreds of millions in assets.
Since ProShares’ volatility funds are ETFs, their managers are not forced to track the index values. They did not fully rebalance by market close on that day, either correctly betting that VIX futures prices would drop the next day, or they didn’t manage to get their trades filled in time. Either way, it saved the shareholders (ironically both 2X long and inverse) a lot of money. Even so, SVXY finished down 91% for the day. For more on this see What Caused the Volatility Volmageddon?
After the February 5th, 2018 debacle there were some changes:
- In February 2018 Credit Suisse’s XIV was terminated.
- In February 2018 Proshares reduced the leverage on SVIX from -1X to 0.5X, and UVXY’s leverage from 2X to 1.5X.
- In December 2018 The Cboe widened allowed spread limits on TAS orders to +-0.5 pts.
- In January 2021 the Cboe shifted the VIX futures settlement time from 4:15 PM to match the equity market’s 4 PM ET close and added a 30-second Volume Weighted Average Price calculation right before close as the default process for calculating the daily settlement price.
These changes likely improved the robustness of the VIX futures market, but architectural weaknesses in the indexes remained unaddressed.
Enter The New SHORTVOL and LONGVOL Indexes
The SHORTVOL and LONGVOL indexes quantify trading strategies that reduce the market impact of rolling/rebalancing VIX futures-based volatility ETPs. The discussion below is based on my analysis of the indexes’ methodology as described in the UVIX and SVIX prospectus.
Instead of relying on a single price and time for determining their reference end-of-day values, these new indexes use a pair of time-weighted averages (price and TAS offset) for each of the m1 and m2 futures contracts. The averaging processes begin 15 minutes before market close, taking data at five-second intervals, each gathering a total of 180 data points to be averaged. Specifically, those averages are:
- The time-weighted average trade prices (TWAP) for m1 and m2 VIX futures
- The time-weighted average offsets (TWAO) of TAS trades for the m1 and m2 VIX futures
The data collected is the last trade value, not the average of trades in the previous 5 seconds. If no trades occur in the 5-second measurement interval the most recent trade is used.
After the market closes and the CFE publishes the TAS value, then the end-of-day VIX Future Time Weighted (VFTW) contract price for the m1 and m2 futures can be computed. The VFTW is just the average of the time-weighted prices and the time-weighted TAS offset added to the final TAS price. For the front month, m1 future: VFTWm1,t = (TWAPm1,t/2 + (TWAOTAS1,t + TAS)/2).
If m1 was trading flat all day at 20, and then jumped 10% in the last minute of trading to 22, the end-of-day TWAPm1,t value would be 20.1333. The time-weighted average price would incorporate only 1/15th of the last-minute move. Assuming the TAS offset TWAO value was +0.01 at 4 PM and the closing TAS value was 22.1 then the TWAOm1,t would be 22.11. Averaging the TWAP & TWAO values together gives a VFTW of 21.1217 for m1.
The Cboe publishes the results of these intermediate calculations as VFTW1 and VFTW2.
The Final Steps
Once the VFTW prices for m1 and m2 have been calculated, then the next step is to calculate the Portfolio Daily Return (PDR). However, one additional piece of information is needed, the Contract Weighting (CW). This number is used to specify the target mix of VIX futures on any given trading day. The CW for m1 is just the number of business days remaining before m1’s expiration divided by the total number of business days that it was the next to expire future. The target mix for m2 futures is just one minus the CWm1 value. For example, If m1 was the front month future for 21 business days, then the day before m1 expires, the target mix of m1 futures will be 1/21 of the total contracts, approximately 4.76% and the target mix for m2 would be 20/21, approximately 95.24% of the VIX futures contracts being held.
The Portfolio Daily Return is a percentage calculated with the following equation:
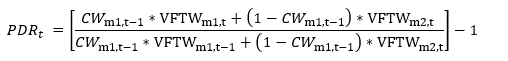
The end-of-day LONGVOL value is the previous trading day’s LONGVOL close multiplied by one plus today’s Portfolio Daily Return (PDR).
LONGVOLt = LONGVOLt-1 * (1 + PDRt)
SHORTVOL’s end-of-day value is just the previous day’s SHORTVOL value multiplied by the one minus the PDR.
SHORTVOLt = SHORTVOLt-1 * (1- PDRt)
Comparing the New and the Old
The chart below shows LONGVOL’s moves relative to SPVXSP since their December 20th, 2005 starting dates. The LONGVOL index started at 1 million, vs 100K for SPVXSP, so the SPVXSP values have been normalized by multiplied by 10.
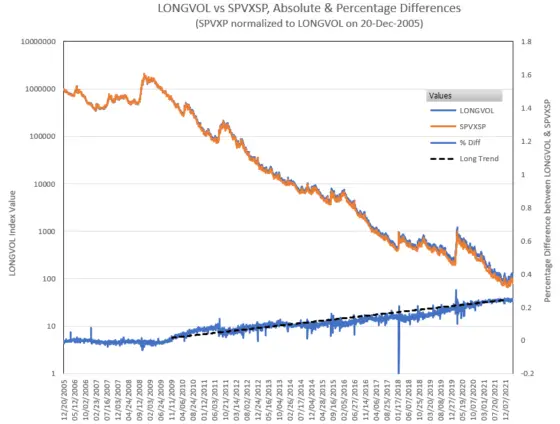
As shown by the blue percentage line, the two indexes initially stayed close together, but in late 2009 started diverging by about 0.0072% a day, 1.8% annually. Volatility ETPs first started gathering significant assets in late 2009, so it seems likely the divergence is related to ETP rolling/rebalancing activities. As of December 2021, the difference between LONGVOL and SPVXSP had grown to 24%.
The spikes on the blue line are associated with big moves in the VIX futures after the 4 PM ET market close but before the VIX Futures settlement time, with the biggest spike on February 5th, 2018.
As the next chart shows, the differences between SHORTVOL and its inverse SPVXSP equivalent are more dramatic…
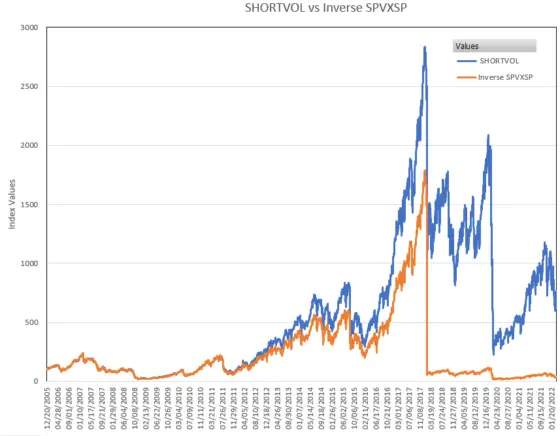
There are two significant divergences between SHORTVOL and inverse SPVXSP. The dramatic one is the 5-Feb-2018 “Volmageddon”, where the inverse SPVXSP dropped 94% and SHORTVOL dropped 30%. Less dramatic are the gains of SHORTVOL relative to the inverse of SPVXSP from 2012 to 2018. This divergence amounted to around 0.035% per trading day, 9% per year. The beginning of the divergence is coincident with the Cboe’s introduction of the TAS order type in November 2011. The daily percentage outperformance of SHORTVOL vs inverse SPVXSP disappeared after 5-Feb-2018.
Predicting The Future Performance of LONGVOL
No one can predict the future moves of these indexes, but there are some things we can say about their likely absolute performance and performance relative to each other.
For example, in the long run, LONGVOL will likely continue its decline.
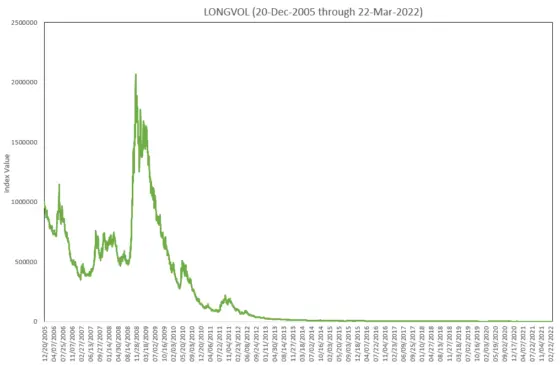
On the chart above, which uses a linear vertical scale, you can’t even see the dramatic percentage moves that LONGVOL made in the 2018 through 2021 timeframe because the index had declined so precipitously from its starting value of 1 million on 20-Dec-2005.
Massive decay in long volatility indexes over time results from structurally high contango (typically 80% to 85% of the time) in the VIX futures term structure. When the term structure is in contango futures with more time until expiration will be priced higher than the sooner-to-expire futures, and the soonest-to-expire future is priced higher than the spot, “buy and take delivery now” price. Since LONGVOL models a long portfolio of VIX futures, if the futures are in contango then all the futures held will be tending to lose value every day. For more on this see the Cost of Contango.
Much of the time, when equity markets are going sideways or up, LONGVOL’s value will be decaying, often rapidly (e.g., 4.5% per month, 56% per year). But before you start shorting LONGVOL-based products please, take a look at the following chart.
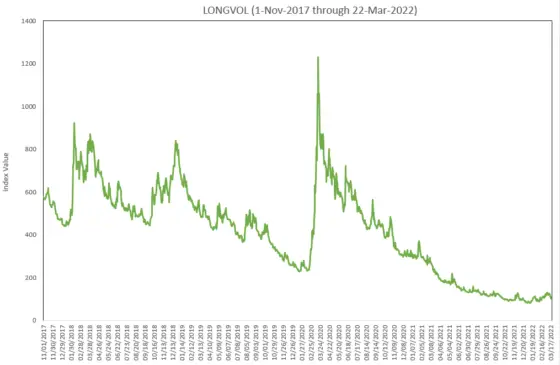
In the space of 25 trading days, during the Covid Crash (12-Feb-2020 to 18-Mar-2020), LONGVOL climbed from 231 to 1229, a climb of over 400% (5.3X). Think of the margin capital required to maintain a short position during a spike of that magnitude!
The two charts above illustrate the opportunities and challenges of using a LONGVOL based product for protecting against equity downturns. If you just buy and hold a position there’s likely to be a significant decay before a big volatility event occurs, and even when a crash does occur it probably won’t get you back to breakeven, much less be significantly profitable. Strategies that wait until volatility spikes are already happening, and exit quickly once volatility begins to fade, are much more likely to be successful.
Predicting Future Performance of SHORTVOL
In contrast to LONGVOL, the calculated track record of SHORTVOL from 2005 is impressive, averaging an annual compound growth rate of over 14% starting from the December 20th, 2005 first value date up through 31-Dec-2021. But as the table of ten worst drawdowns below shows, the road was very rocky, with drawdowns as large as 92%.
| Rank | % Drop | Date of Maximum Drawdown Percentage | Drawdown Duration (days) |
|---|---|---|---|
| 1 | -91.934% | 18-Mar-2020 | 1080 (as of 25-Mar-2022) |
| 2 | -91.930% | 20-Nov-2008 | 1405 |
| 3 | -64.983% | 11-Feb-2016 | 357 |
| 4 | -42.254% | 30-Jan-2015 | 218 |
| 5 | -40.385% | 14-Jun-2006 | 103 |
| 6 | -27.843% | 5-Feb-2014 | 79 |
| 7 | -26.606% | 24-Jun-2013 | 66 |
| 8 | -24.323% | 17-Aug-2017 | 46 |
| 9 | -21.731% | 28-Dec-2012 | 14 |
| 10 | -20.521% | 8-Oct-2013 | 20 |
The drawdown metric quantifies the maximum percentage decrease from a previous all-time high. It highlights the risks of holding funds based on the SHORTVOL index for long periods. Because of susceptibility to often-sudden downturns, a multi-year “buy & hold” strategy on a SHORTVOL based ETP carries a high risk of major setbacks. Some sort of protection scheme, based on market indicators, or option hedging will probably be a key component of any successful short volatility trading strategy.
Predicting Future Performance of These Indexes: SHORTVOL vs. LONGVOL
While the absolute value of the daily percentage moves of SHORTVOL and LONGVOL will match each other, the long-term performance of SHORTVOL will lag the inverse of the long-term performance of LONGVOL. For example, if LONGVOL is down 30% for the year, SHORTVOL’s percentage gain will be less than that. A phenomenon called volatility drag is the culprit. Volatility drag often results from the daily rebalancing that a leveraged fund (-1X leverage in this case) must accomplish to achieve its leveraged daily percentage goals relative to its underlying index. For example, if LONGVOL goes up 25% one day and down 20% the next day it ends up back where it started, whereas during that same sequence SHORTVOL, with an -25% day followed by a +20% day will end up down 10%.
In the long-run volatility is always with us, so the long-term lag of SHORTVOL relative to the opposite of LONGVOL is inevitable.
Somewhat surprisingly, the long-term volatility drag of a -1X leveraged index matches the volatility drag of a 2X levered index, the formula being volatility drag = L*(L-1)*σ2/2, where L is the leverage and σ is the volatility of the reference index.. If L = -1 then the calculated volatility drag will be -1*(-1-1)*σ2/2 which equals σ2. A leverage of 2 has the same result, σ2. This means that the new 2X leveraged UVIX, which uses a 2x levered version of LONGVOL for its index, will experience volatility drag similar to the -1X levered SVIX.
SHORTVOL has averaged an annualized volatility of ~68% per year, so its volatility drag versus the opposite of LONGVOL will be in the neighborhood of 46% per year (0.682= 0.46).
Historical Data
If you are interested in the open, high, low, close daily values of SHORTVOL back to December 20th, 2005 you can download them from Yahoo Finance (ticker: ^SHORTVOL). Unfortunately, in that .csv file, there are currently around 20 trading dates that show up as “null”. The Cboe also publishes SHORTVOL historical data, but that data only goes back around 3 months. Yahoo Finance provides current LONGVOL quotes (ticker ^LONGVOL), but currently, there is no historical data. I offer a free SHORTVOL/LONGVOL spreadsheet that has closing values since December 20th, 2005.
Conclusions
- While it’s important to be aware of LONGVOL and SHORTVOL performance based on historical data, the correlations between equities, the VIX, and VIX futures are not static. Those correlations evolve, and that may impact the performance of these new indexes
- It’s my opinion (which I’ve expressed to the SEC), that all leveraged ETPs, not just volatility-based products, should use time-weighted indexes like LONGVOL/SHORTVOL to reduce their dependence on single, end-of-day prices for their rebalancing activities.
- Due to the time-distributed architecture of the weighted averages underlying the LONGVOL and SHORTVOL indexes, Exchange Trade Products based on these indexes should be significantly less vulnerable to front running and liquidity withholding. This will enable them to better track the actual volatility of the market. If SVIX and UVIX gain significant market share I believe that their distributed buying/selling processes will make the overall VIX futures market more robust.
For more information:
Hi Vance
Thank you for your great explanation.
I tried to understand the Shortvol calculation equation, and I found there is no beta slippage came out. I might make a mistake though.
Can you check and confirm the equation for the PDR? t and t-1 maybe not right.
Regards
Justin
Hi Vance,
Thanks for the outstanding work and education you provide for the volatility community. It’s truly invaluable.
I have a question regarding the SHORTVOL index. Since the TWAP values of VIX futures are only available as EOD, how is the intraday value of SHORTVOL derived? It is based on the intraday quotes of near-term VIX futures contracts, in the same way as the inverse SPVXSP?
Thank you for your insights.
Best regards
George Hategan
Hi George,
Thanks for the feedback, it’s appreciated.
Regarding the SHORTVOL index, until that last 15 minutes before trading ends its percentage moves typically will be similar to the inverse of the SPVXSP. The base calculations are the same. It’s specifically tied to the value of the combined VIX futures, weighted appropriately. One subtlety is that if the closing value of SHORTVOL and SPVXSP is significantly influenced by end of day dynamics the trade day before, then the observed percentage moves will be reported as different. For example if normalized SHORTVOL closes at 100 and the SPVXSP closes at 101, then if the value of the appropriate futures, the SPVXSP value is 102 the next day SHORTVOL will be down 2% and inverse SPVXSP will be down ~1%.
Best Regards,
Vance
Thank you, Vance. Great work as always. Where can anyone receive live data on these indeces? I see only delayed prints everywhere these indeces are quotable.
Hi Steven,
For realtime short/longvol quotes you’d probably have to go the Cboe for that. They offer delayed quotes for free https://www.cboe.com/delayed_quotes/longvol/advanced_charts
Best Regards,
Vance
Great write up! Thank you.